| Start Page |
|
 |
| Start Page |
|
|
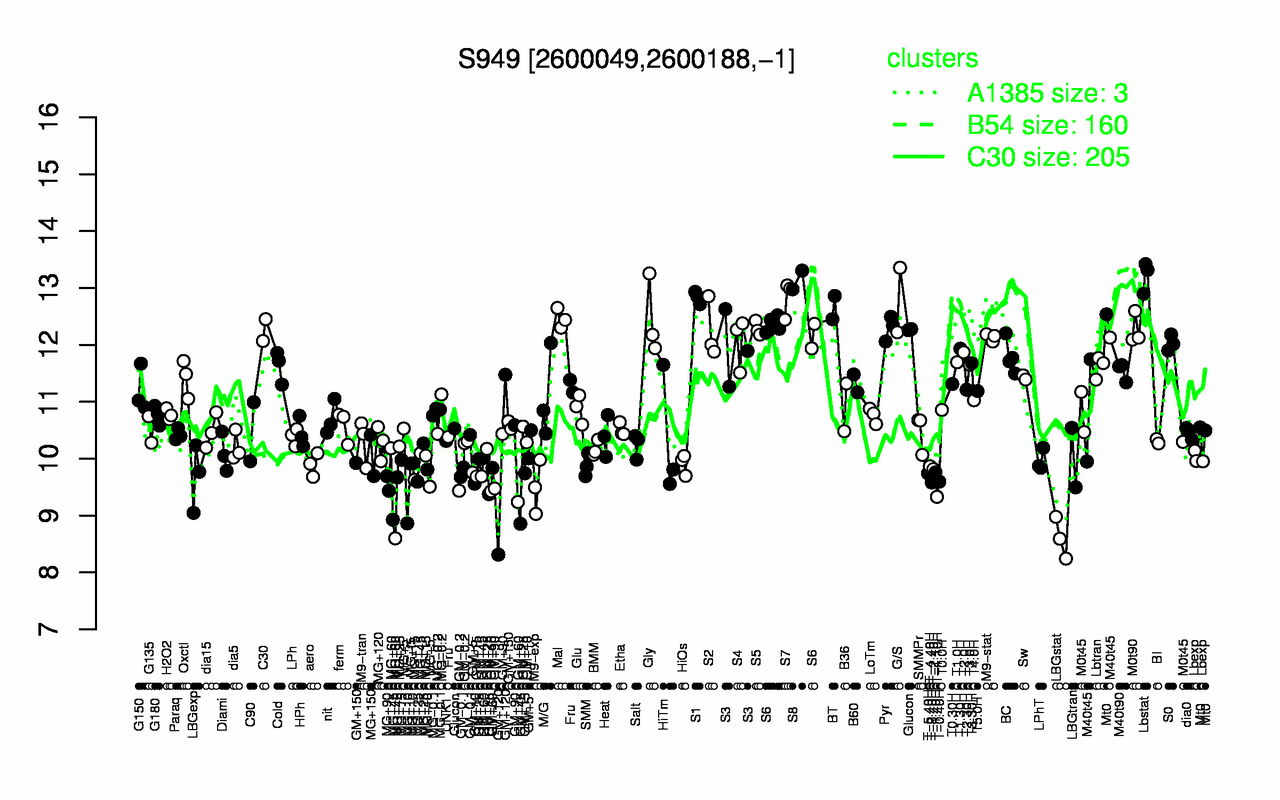
| Lbstat | S8 | S1 | S7 | G/S | BT | Mal | Gly | S6 | Pyr |
| 13.2 | 13.1 | 12.8 | 12.8 | 12.8 | 12.7 | 12.5 | 12.5 | 12.3 | 12.3 |
| LBGstat | GM+45 | T-1.10H | MG+60 | M9-exp | MG+10 | MG+90 | MG+45 | T-3.40H | T-0.40H |
| 8.6 | 9.32 | 9.33 | 9.39 | 9.5 | 9.53 | 9.56 | 9.56 | 9.58 | 9.6 |