| Start Page |
|
 |
| Start Page |
|
|
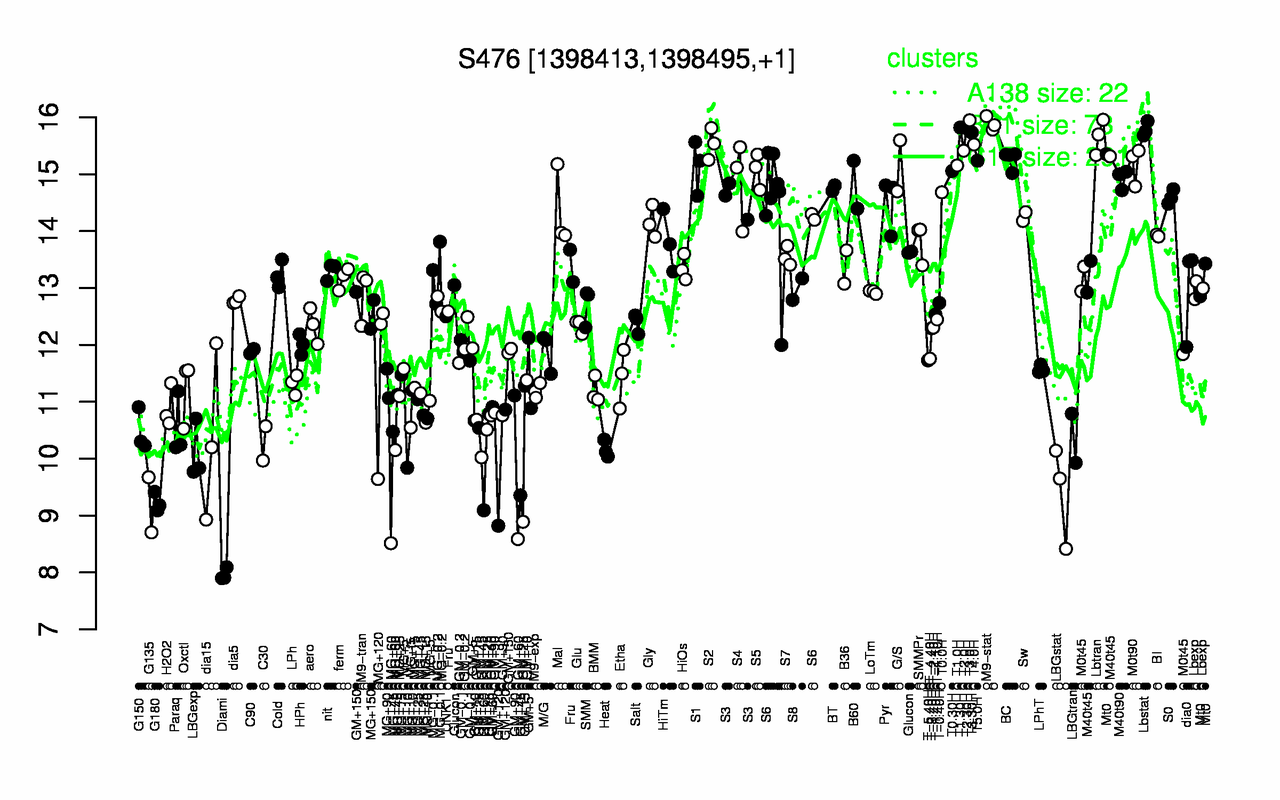
| T3.0H | M9-stat | T1.30H | T2.30H | Lbstat | T3.30H | Lbtran | S2 | T4.0H | T2.0H |
| 15.9 | 15.9 | 15.8 | 15.8 | 15.8 | 15.7 | 15.7 | 15.5 | 15.5 | 15.4 |
| Diami | G135 | G180 | MG+60 | LBGstat | GM+60 | GM+120 | GM+25 | GM+45 | LBGexp |
| 7.97 | 9.19 | 9.23 | 9.33 | 9.4 | 9.53 | 9.84 | 9.98 | 10 | 10.1 |