| Start Page |
|
 |
| Start Page |
|
|
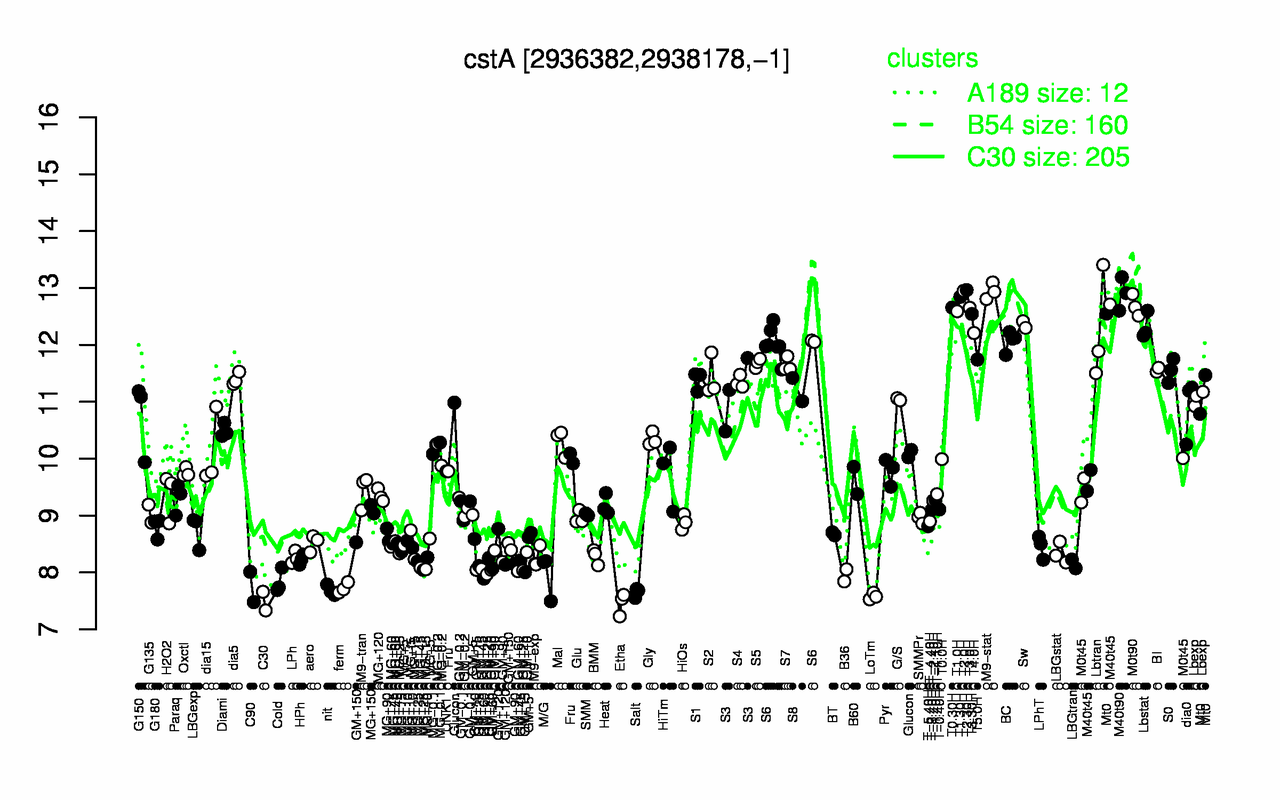
| T2.30H | T2.0H | M9-stat | M40t90 | T1.30H | M0t90 | T0.30H | T3.0H | T1.0H | T3.30H |
| 13 | 12.9 | 12.9 | 12.9 | 12.8 | 12.7 | 12.7 | 12.7 | 12.6 | 12.5 |
| Etha | C30 | LoTm | Salt | nit | ferm | C90 | Cold | B36 | M/G |
| 7.46 | 7.5 | 7.58 | 7.65 | 7.69 | 7.73 | 7.74 | 7.84 | 7.95 | 7.96 |