| Start Page |
|
 |
| Start Page |
|
|
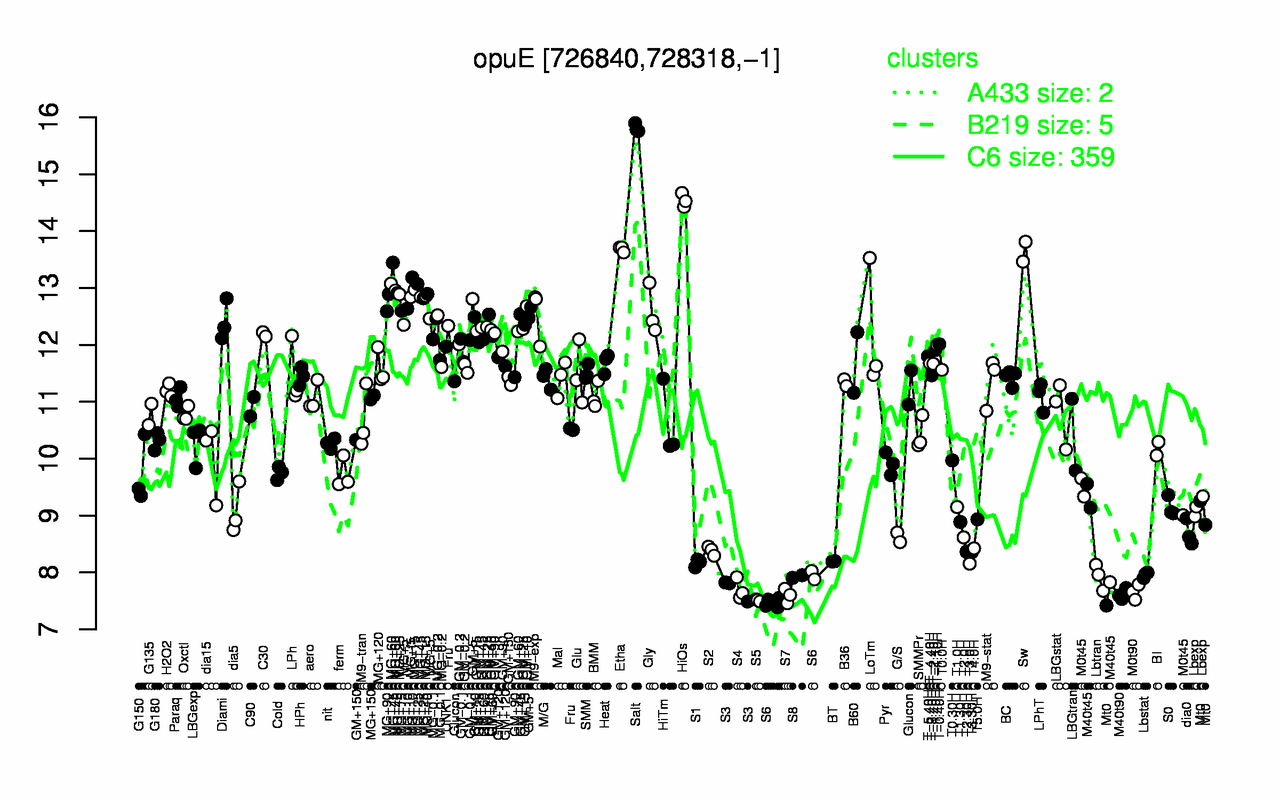
| Salt | HiOs | Etha | Sw | MG+45 | MG+60 | MG+25 | MG+10 | MG+t5 | MG+15 |
| 15.8 | 14.5 | 13.7 | 13.6 | 13.1 | 13 | 12.9 | 12.9 | 12.8 | 12.8 |
| S5 | S6 | S7 | M40t90 | M0t90 | S4 | S3 | Lbtran | S8 | Lbstat |
| 7.51 | 7.58 | 7.59 | 7.62 | 7.66 | 7.7 | 7.71 | 7.92 | 7.93 | 7.96 |