| Start Page |
|
 |
| Start Page |
|
|
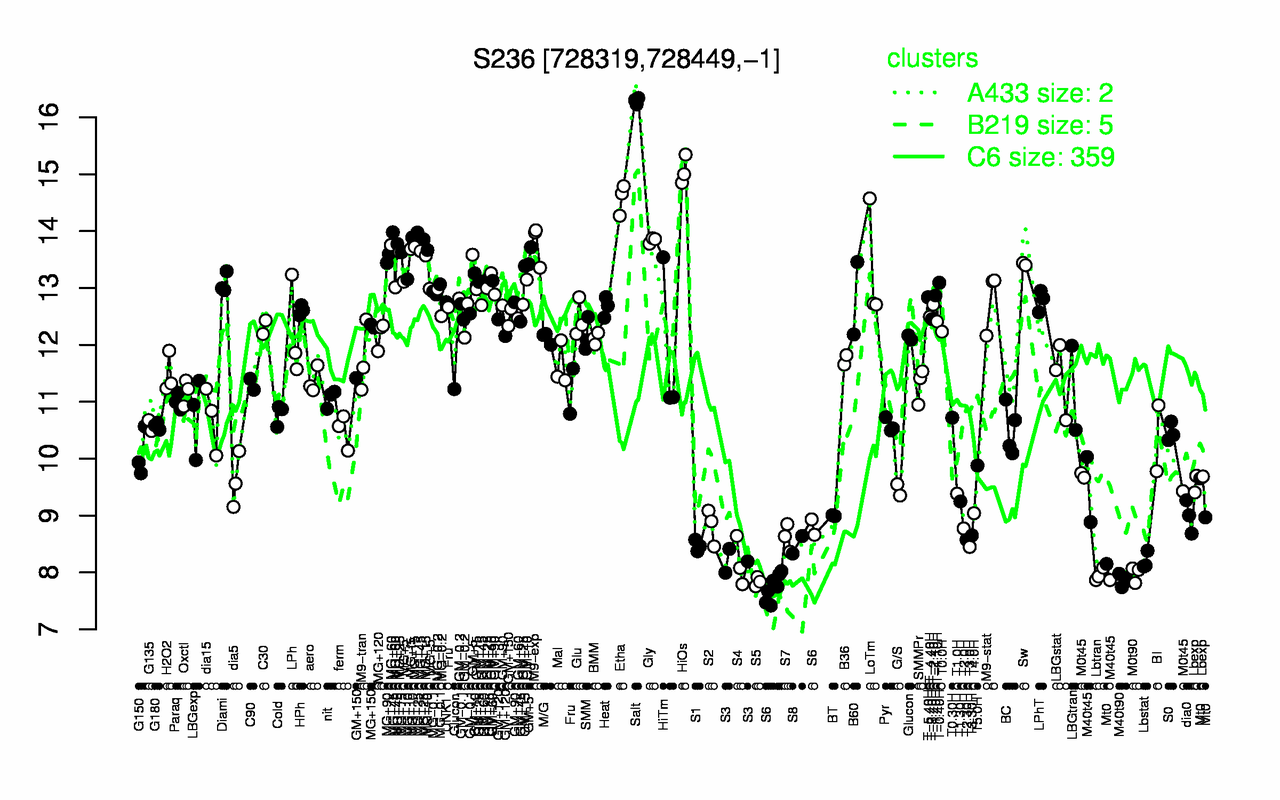
| Salt | HiOs | Etha | Gly | MG+25 | MG+45 | M9-exp | MG+t5 | MG+15 | GM+5 |
| 16.3 | 15.1 | 14.6 | 13.8 | 13.8 | 13.8 | 13.8 | 13.7 | 13.6 | 13.6 |
| S5 | M40t90 | Lbtran | S6 | M0t90 | S4 | S3 | Lbstat | T3.0H | S1 |
| 7.84 | 7.87 | 7.96 | 7.97 | 7.98 | 8.17 | 8.2 | 8.2 | 8.45 | 8.47 |