| Start Page |
|
 |
| Start Page |
|
|
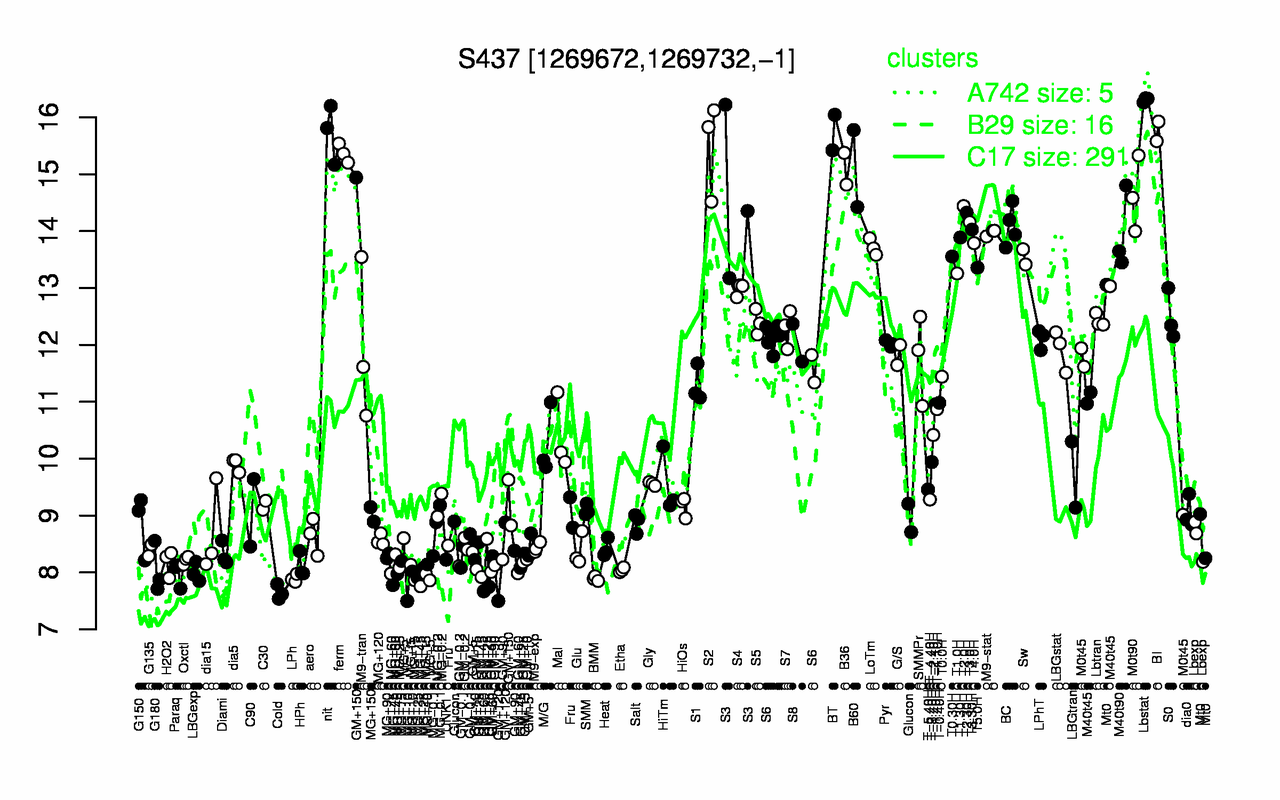
| Lbstat | BI | BT | nit | S2 | ferm | B60 | B36 | M0t90 | S3 |
| 16.3 | 15.8 | 15.7 | 15.7 | 15.5 | 15.4 | 15.1 | 15.1 | 14.6 | 14.6 |
| Cold | MG+45 | MG+10 | BMM | LPh | Paraq | GM+60 | LBGexp | GM+45 | MG+15 |
| 7.65 | 7.84 | 7.89 | 7.89 | 7.9 | 7.98 | 7.98 | 8 | 8 | 8.01 |