B. subtilis Expression Data Browser
Details about yncM Show/Hide
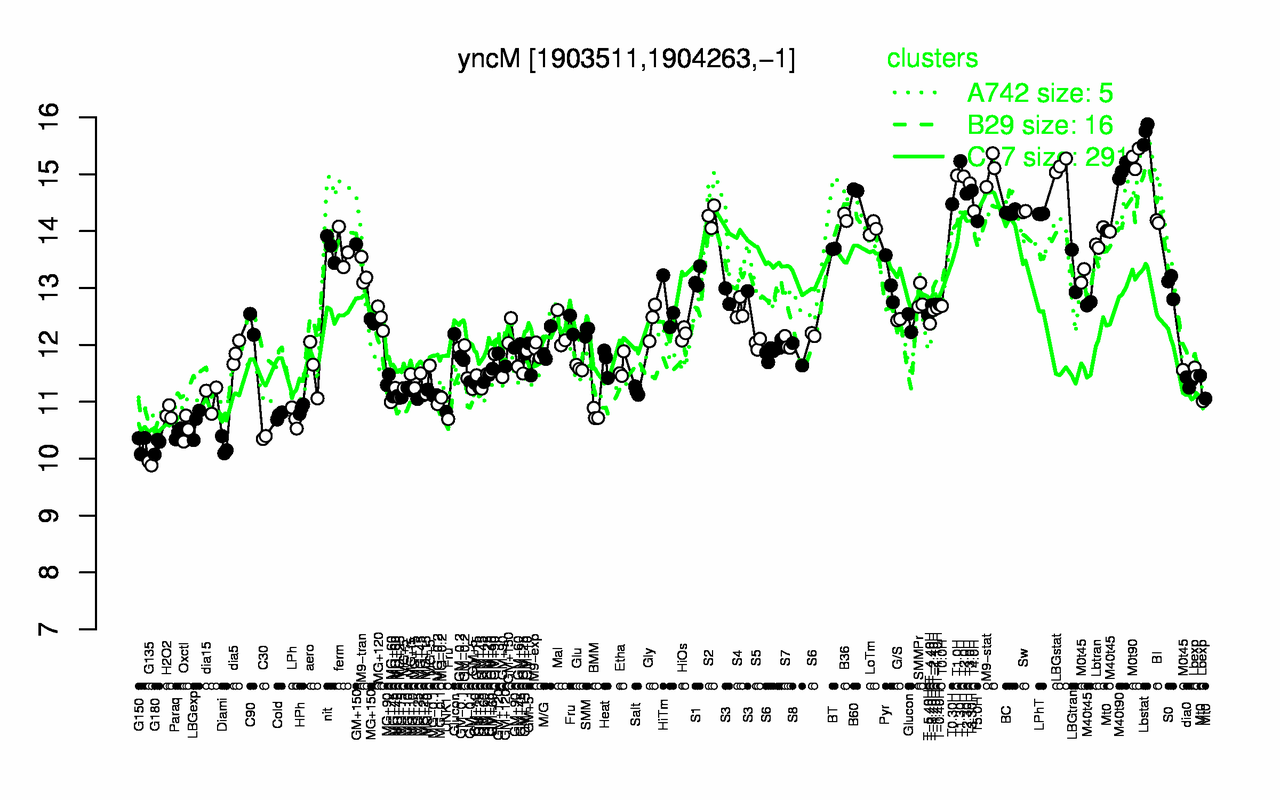
Highest Expression Conditions
Lbstat M0t90 T1.30H LBGstat M9-stat M40t90 T1.0H T2.0H T3.0H B60
15.7 15.3 15.2 15.1 15.1 15.1 15 15 14.8 14.7
Lowest Expression Conditions
G135 Diami G180 G150 C30 Paraq Oxctl LBGexp LPh Cold
9.92 10.2 10.2 10.3 10.4 10.4 10.5 10.6 10.7 10.8
Most Positively Correlated Segments
csn xynD S676 yjdB S437 yisT yerI yoqM yoeA dacC
0.91 0.86 0.86 0.85 0.85 0.84 0.84 0.84 0.83 0.83
Most Negatively Correlated Segments
speE speB pit yfnA S1452 yvsG S419 ksgA yjbQ yfmL
-0.86 -0.81 -0.8 -0.79 -0.78 -0.78 -0.77 -0.77 -0.76 -0.75
Expression Profile of Segment yncM Show/Hide
Annotation of Gene yncM Show/Hide
inference
ab initio prediction:AMIGene:2.0
codon_start
1
product
conserved hypothetical protein
transl_table
11
note
Evidence 4: Homologs of previously reported genes of unknown function
db_xref
GI:2634153
protein_id
CAB13653.1
Genomic View of Gene/Segment yncM Show/Hide
(Legend)