B. subtilis Expression Data Browser
Details about S676 Show/Hide
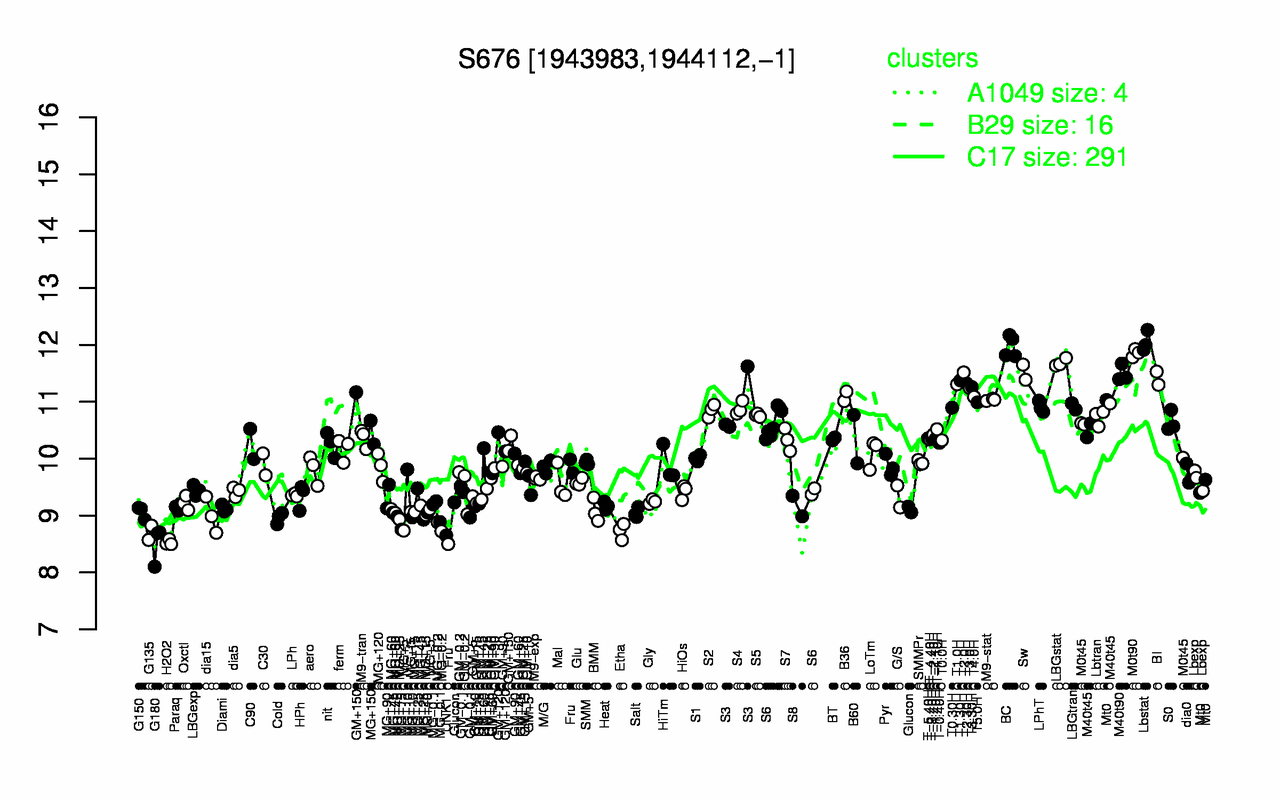
Highest Expression Conditions
Lbstat BC M0t90 LBGstat Sw T2.0H M40t90 BI T1.30H T2.30H
12.1 12 11.9 11.7 11.5 11.5 11.5 11.4 11.4 11.3
Lowest Expression Conditions
G180 H2O2 UNK1 G135 Etha MG-0.2 MG+5 MG+15 Cold dia15
8.5 8.53 8.65 8.7 8.72 8.81 8.92 8.94 8.96 9.01
Most Positively Correlated Segments
xynD xynC S677 yncM csn yoqM S437 yjdB phrG yraI
0.98 0.95 0.91 0.86 0.86 0.82 0.78 0.77 0.76 0.75
Most Negatively Correlated Segments
pit lspA ykaA S426 speE S1452 S419 trnD-Cys trnD-Ser prmA
-0.71 -0.71 -0.71 -0.7 -0.7 -0.7 -0.69 -0.68 -0.68 -0.68
Expression Profile of Segment S676 Show/Hide
Genomic View of Gene/Segment S676 Show/Hide
(Legend)