B. subtilis Expression Data Browser
Start Page
B. subtilis Expression Data Browser
Gene/Segment:
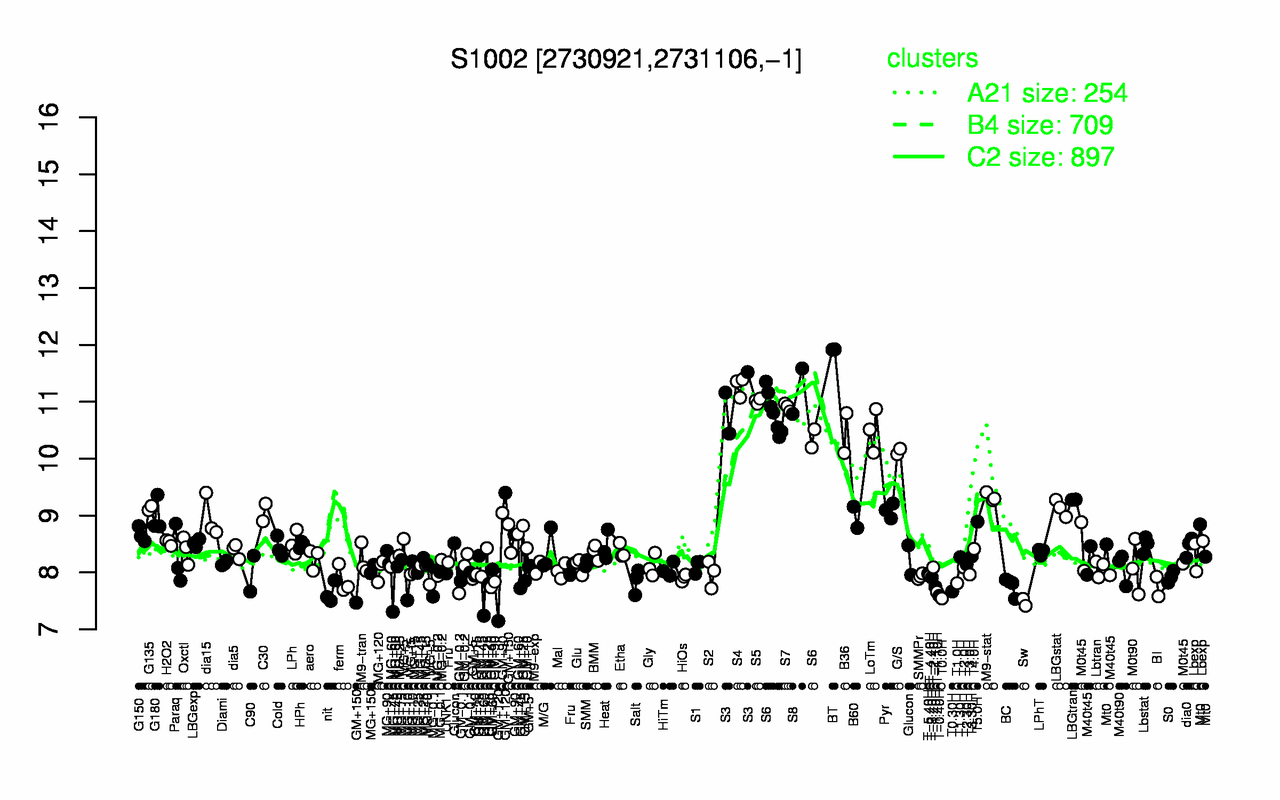
S1002
Locus Tag:
new_2730921_2731106_c
Details about S1002
Show/Hide
Highest Expression Conditions
BT
S4
S8
S3
S5
S7
S6
LoTm
B36
G/S
11.9
11.3
11.2
11
11
10.9
10.7
10.5
10.4
10.1
Lowest Expression Conditions
Sw
T0.0H
T-0.40H
nit
T-1.10H
T0.30H
T-1.40H
BI
BC
GM+45
7.47
7.54
7.59
7.64
7.66
7.67
7.75
7.75
7.77
7.8
Most Positively Correlated Segments
yetF
yrdD
cypA
yugT
yrdD
S111
yqhO
S248
ydhD
S1445
0.9
0.9
0.9
0.88
0.88
0.88
0.87
0.87
0.87
0.87
Most Negatively Correlated Segments
yugH
yugG
yceG
yceH
yceD
yceE
yceF
yceC
sigD
S914
-0.81
-0.81
-0.8
-0.8
-0.77
-0.77
-0.77
-0.77
-0.76
-0.76
Expression Profile of Segment S1002
Show/Hide
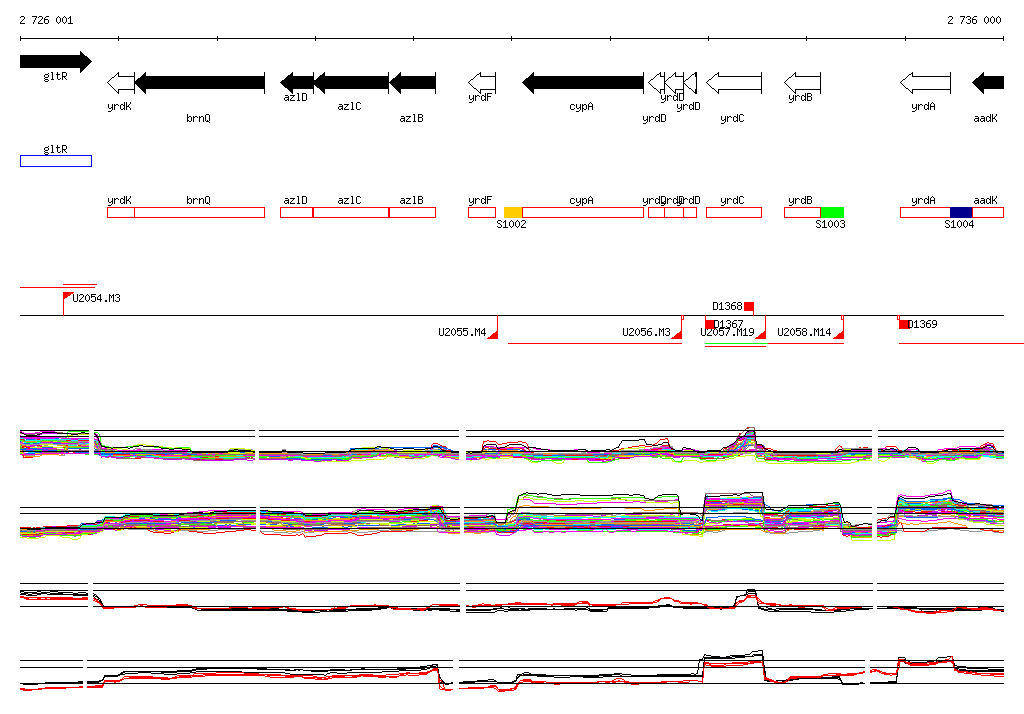
Genomic View of Gene/Segment S1002
Show/Hide
(Legend)
Browse Genome Context