| Start Page |
|
 |
| Start Page |
|
|
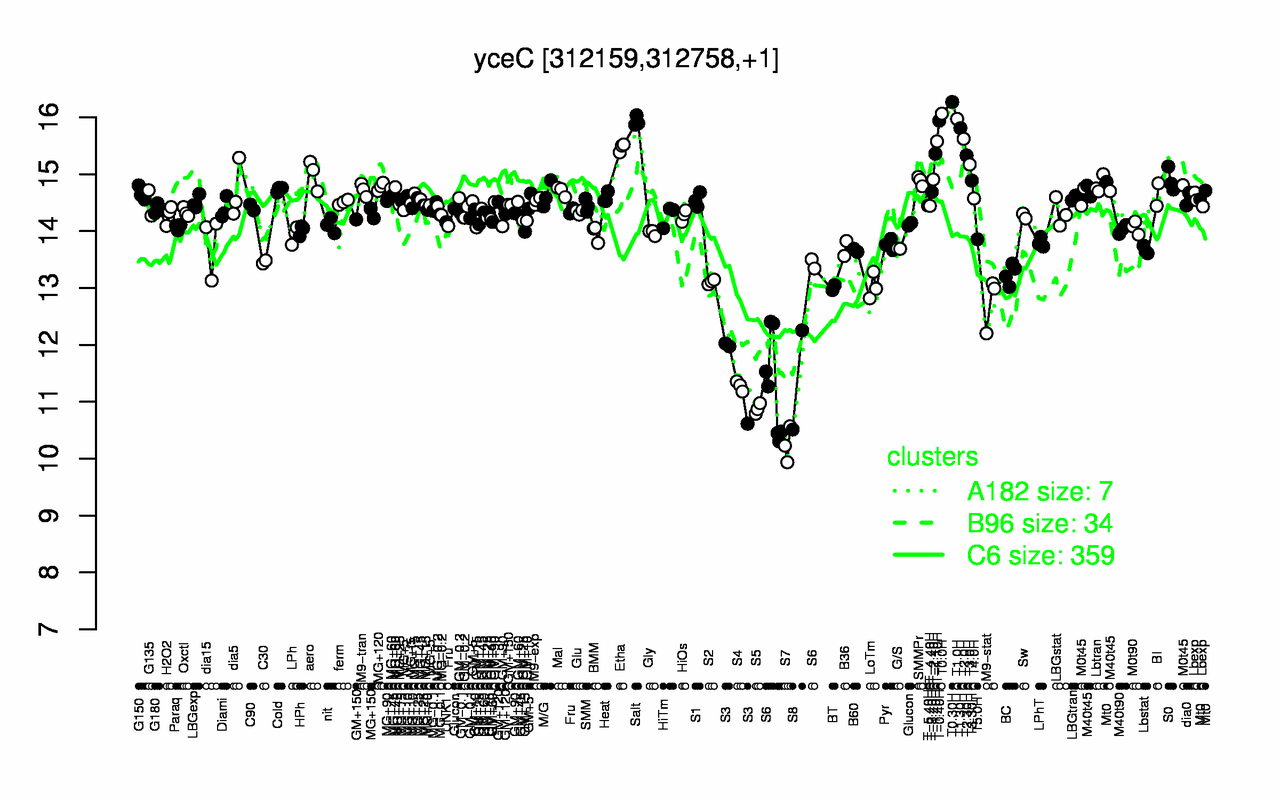
| T0.30H | T0.0H | T1.0H | T-0.40H | Salt | T1.30H | T2.0H | T-1.10H | Etha | T-1.40H |
| 16.3 | 16.1 | 16 | 15.9 | 15.9 | 15.8 | 15.6 | 15.6 | 15.5 | 15.4 |
| S7 | S5 | S4 | S8 | S3 | S6 | M9-stat | BT | LoTm | S2 |
| 10.2 | 10.9 | 11.3 | 11.4 | 11.5 | 11.7 | 12.8 | 13 | 13 | 13.1 |