| Start Page |
|
 |
| Start Page |
|
|
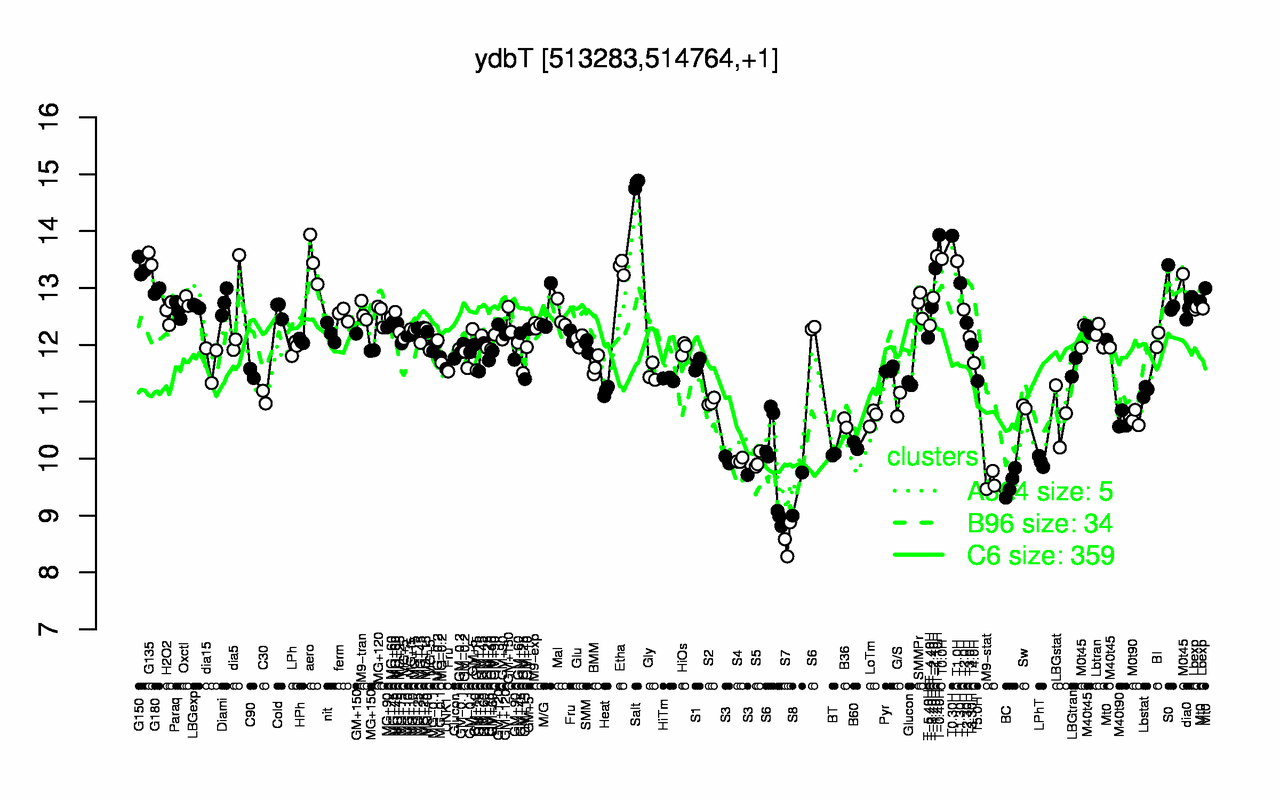
| Salt | T-0.40H | T0.30H | T-1.10H | G135 | T0.0H | aero | T1.0H | G150 | Etha |
| 14.8 | 13.9 | 13.9 | 13.6 | 13.5 | 13.5 | 13.5 | 13.5 | 13.4 | 13.4 |
| S7 | S8 | BC | M9-stat | S3 | LPhT | S5 | S4 | BT | B60 |
| 8.58 | 9.38 | 9.56 | 9.59 | 9.89 | 9.95 | 9.96 | 9.97 | 10.1 | 10.2 |