| Start Page |
|
 |
| Start Page |
|
|
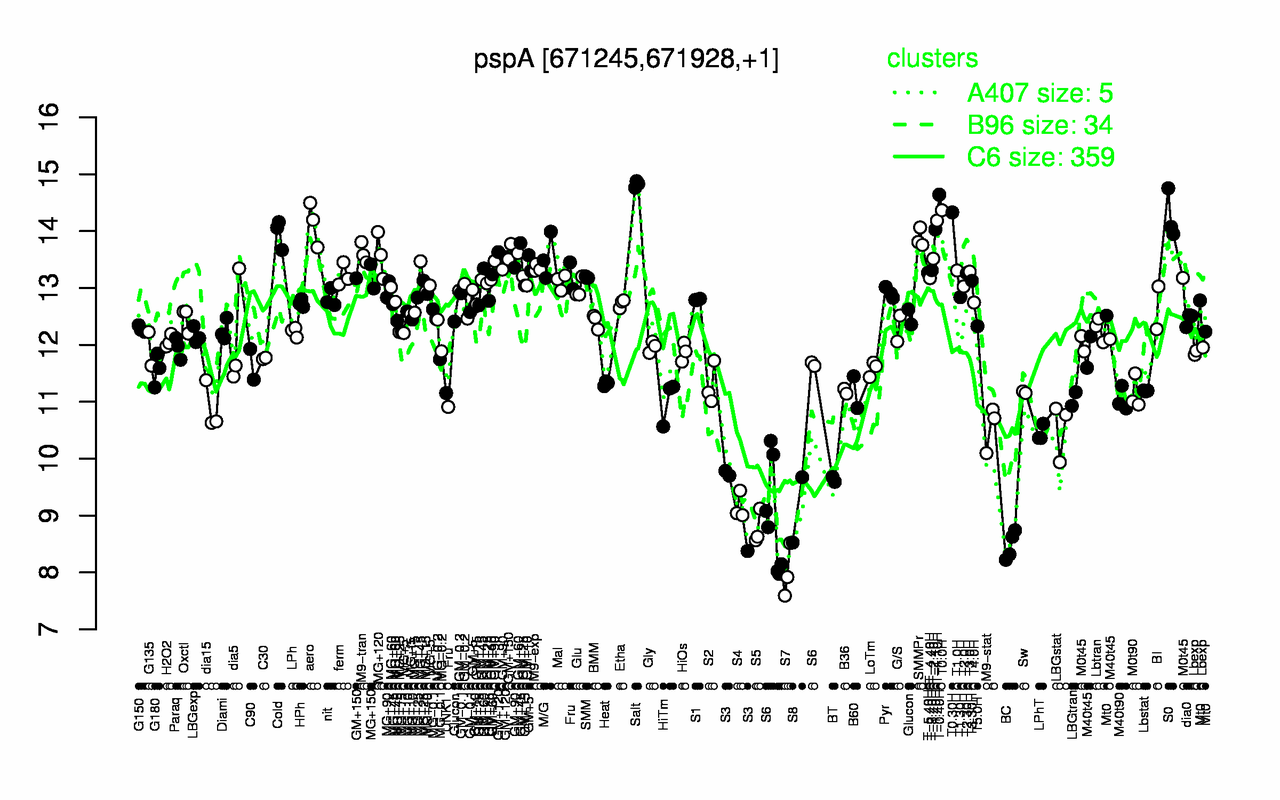
| Salt | T-0.40H | T0.0H | T0.30H | S0 | T-1.10H | aero | T-1.40H | Cold | SMMPr |
| 14.8 | 14.6 | 14.4 | 14.3 | 14.3 | 14.2 | 14.1 | 14 | 14 | 13.9 |
| S7 | BC | S5 | S8 | S4 | S3 | S6 | BT | LPhT | LBGstat |
| 8.01 | 8.48 | 8.77 | 9.1 | 9.16 | 9.29 | 9.52 | 9.64 | 10.4 | 10.5 |