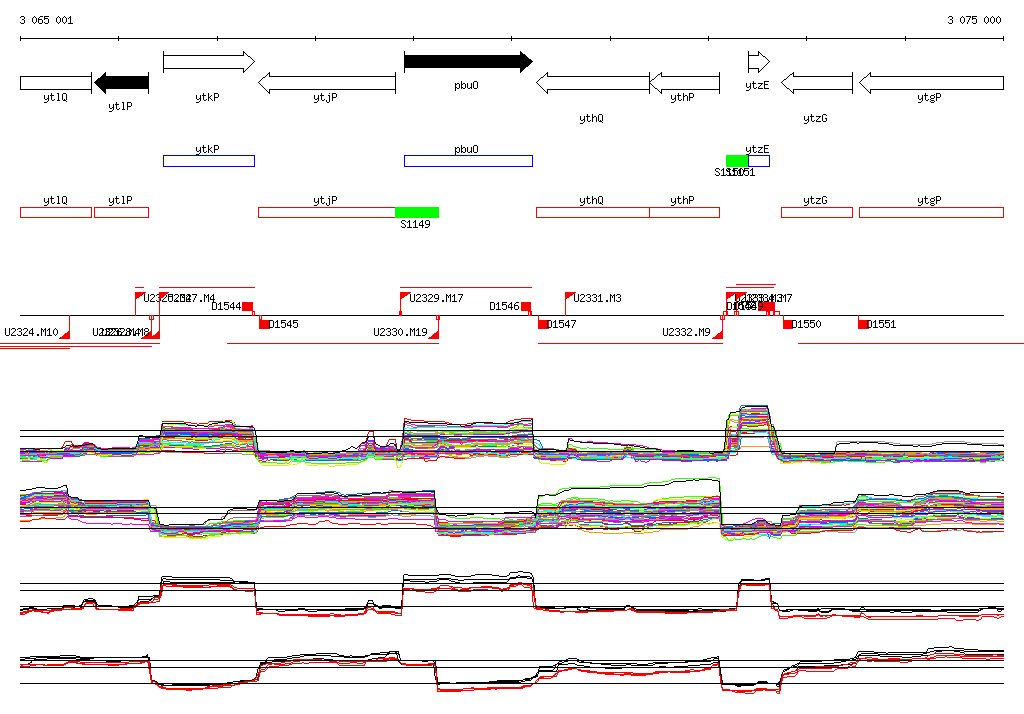
| Start Page |
|
 |
| Start Page |
|
|
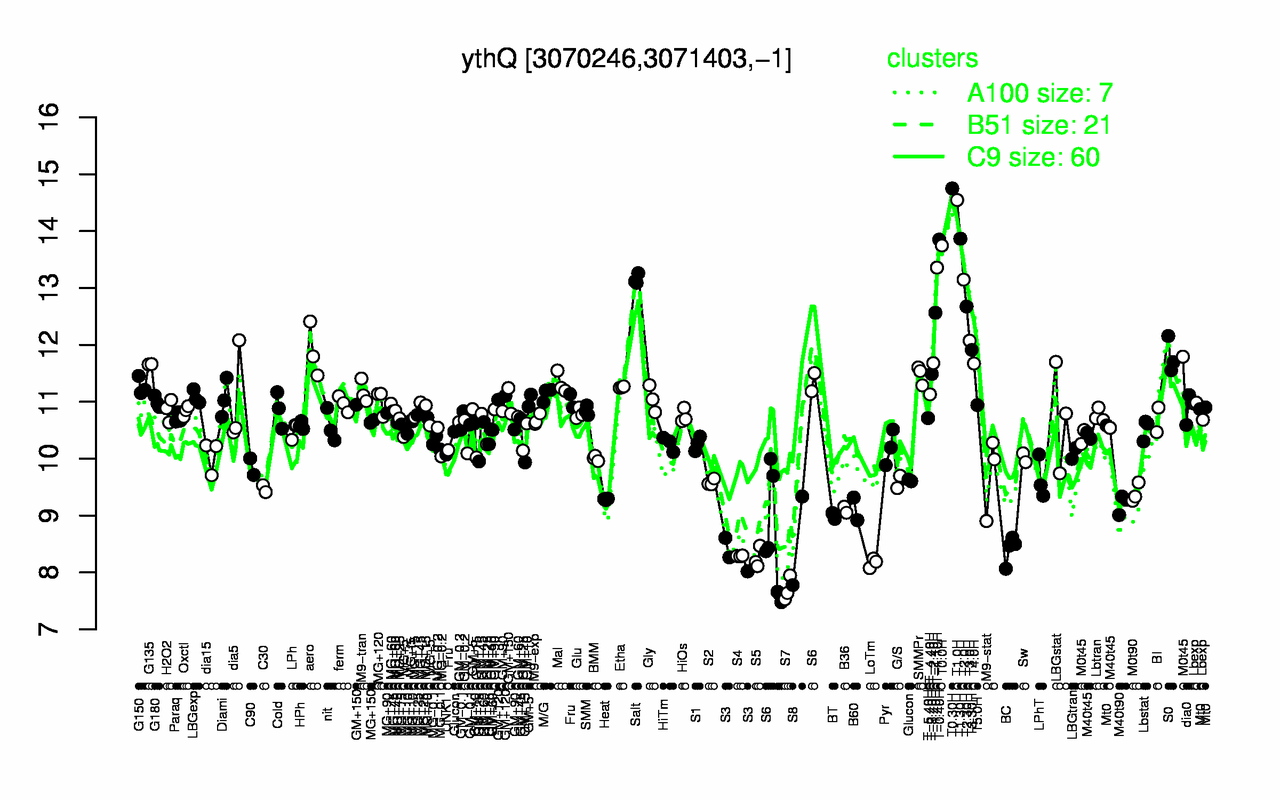
| T0.30H | T1.0H | T1.30H | T-0.40H | T0.0H | T-1.10H | Salt | T2.0H | T2.30H | T-1.40H |
| 14.7 | 14.5 | 13.9 | 13.9 | 13.7 | 13.4 | 13.2 | 13.1 | 12.7 | 12.6 |
| S7 | LoTm | S5 | S4 | S3 | BC | S8 | BT | B36 | S6 |
| 7.7 | 8.17 | 8.25 | 8.29 | 8.3 | 8.41 | 8.56 | 8.99 | 9.1 | 9.11 |