| Start Page |
|
 |
| Start Page |
|
|
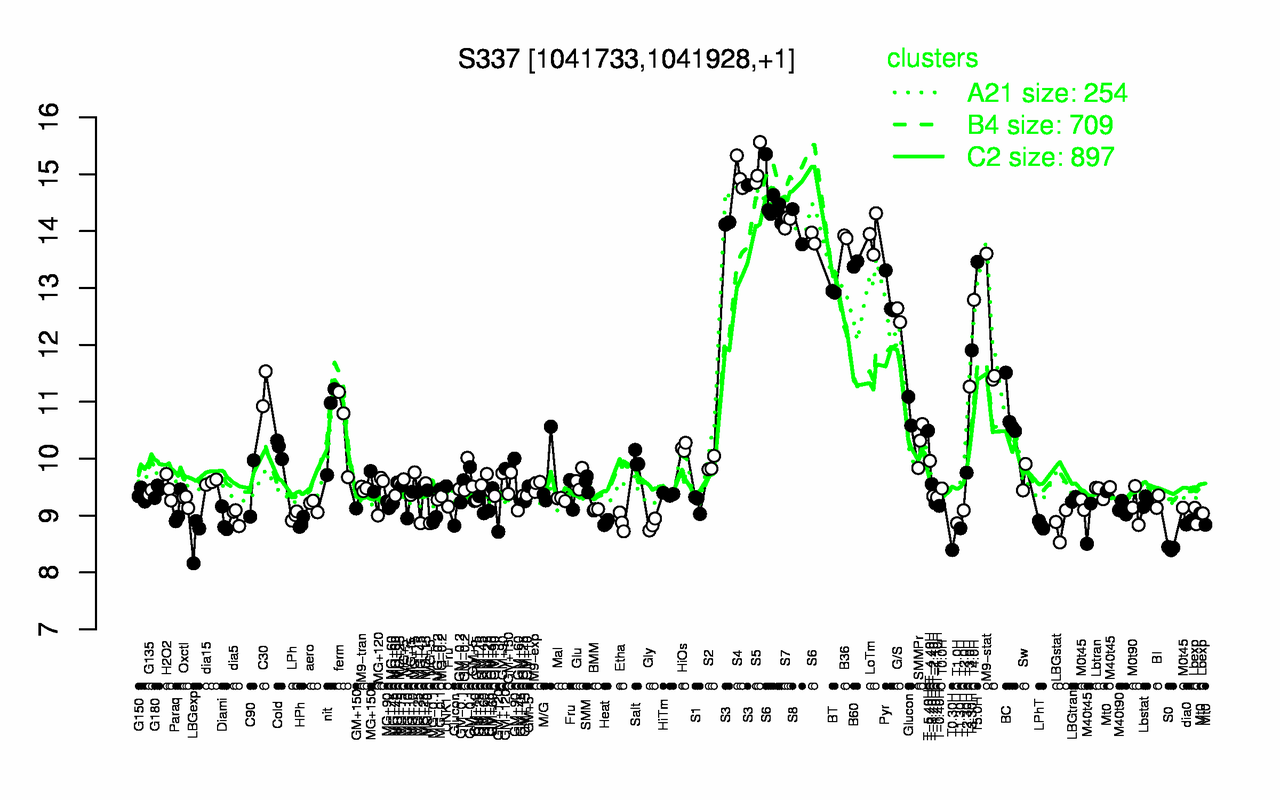
| S5 | S4 | S6 | S3 | S7 | S8 | LoTm | B36 | T5.0H | B60 |
| 15.1 | 15 | 14.4 | 14.4 | 14.2 | 14.1 | 13.9 | 13.9 | 13.5 | 13.4 |
| T0.30H | S0 | LBGexp | T1.30H | LBGstat | Gly | LPhT | T1.0H | Heat | HPh |
| 8.39 | 8.42 | 8.61 | 8.78 | 8.84 | 8.84 | 8.84 | 8.86 | 8.87 | 8.87 |