B. subtilis Expression Data Browser
Start Page
B. subtilis Expression Data Browser
Gene/Segment:
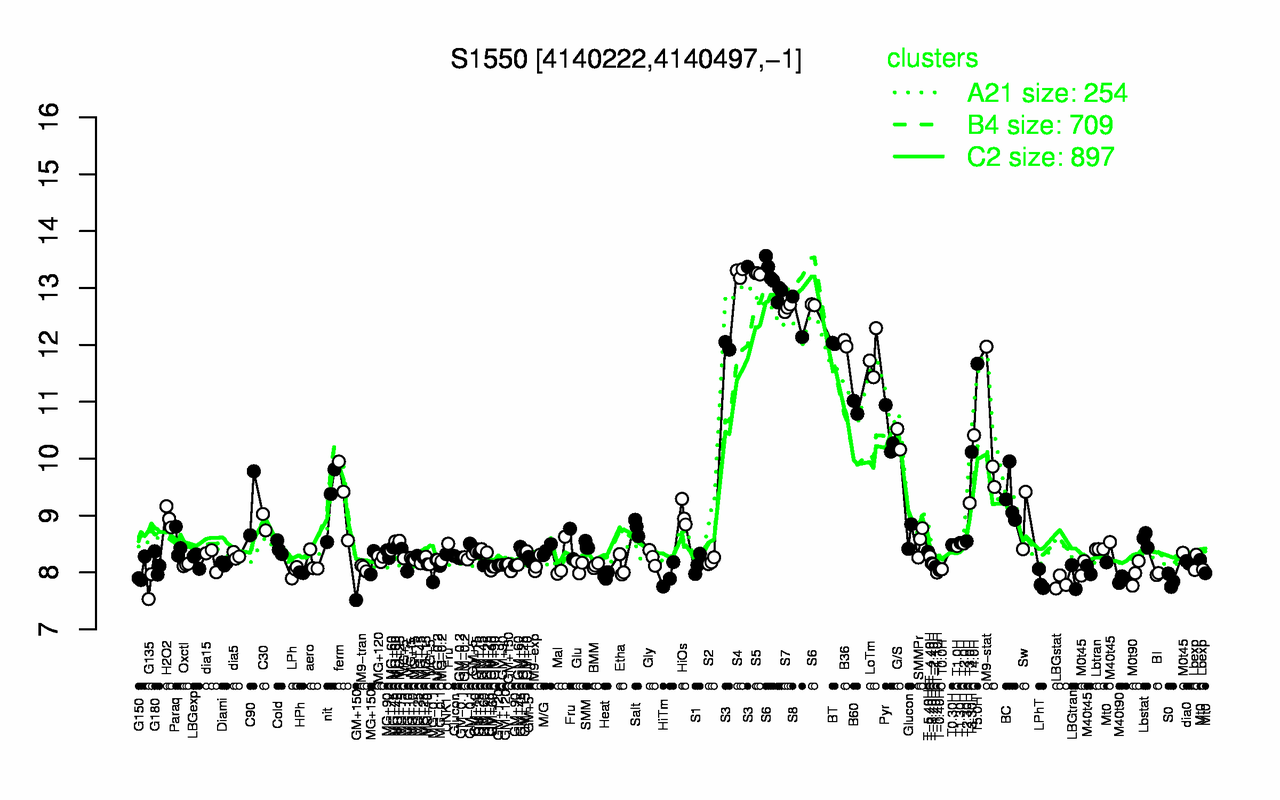
S1550
Locus Tag:
new_4140222_4140497_c
Details about S1550
Show/Hide
Highest Expression Conditions
S4
S5
S6
S7
S8
S3
B36
BT
LoTm
T5.0H
13.3
13.3
13
12.6
12.5
12.4
12
12
11.8
11.7
Lowest Expression Conditions
G135
LBGstat
LPhT
S0
M40t90
GM+150
LBGtran
HiTm
Heat
BI
7.75
7.82
7.86
7.86
7.88
7.89
7.92
7.94
7.94
7.97
Most Positively Correlated Segments
S1445
sodF
yuzC
kamA
S745
yodQ
S337
yodP
S648
S111
0.98
0.97
0.96
0.96
0.96
0.96
0.96
0.96
0.96
0.96
Most Negatively Correlated Segments
sbcD
S378
addA
sbcC
addB
kinC
yvrG
yeaC
yugH
yeaD
-0.9
-0.9
-0.89
-0.89
-0.88
-0.88
-0.88
-0.87
-0.86
-0.85
Expression Profile of Segment S1550
Show/Hide
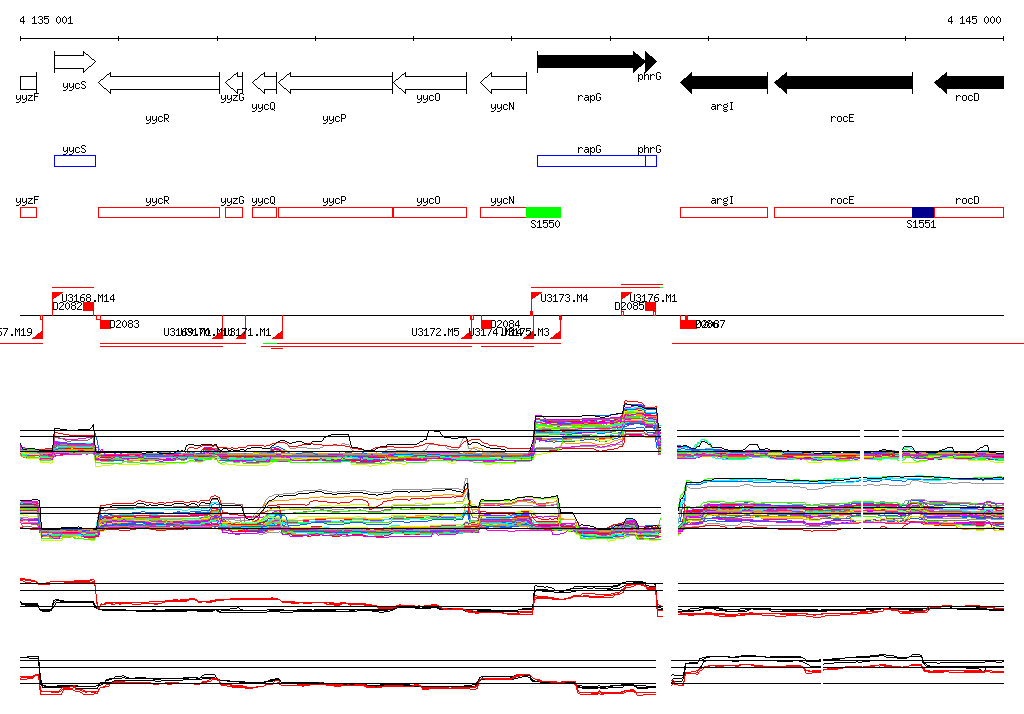
Genomic View of Gene/Segment S1550
Show/Hide
(Legend)
Browse Genome Context