| Start Page |
|
 |
| Start Page |
|
|
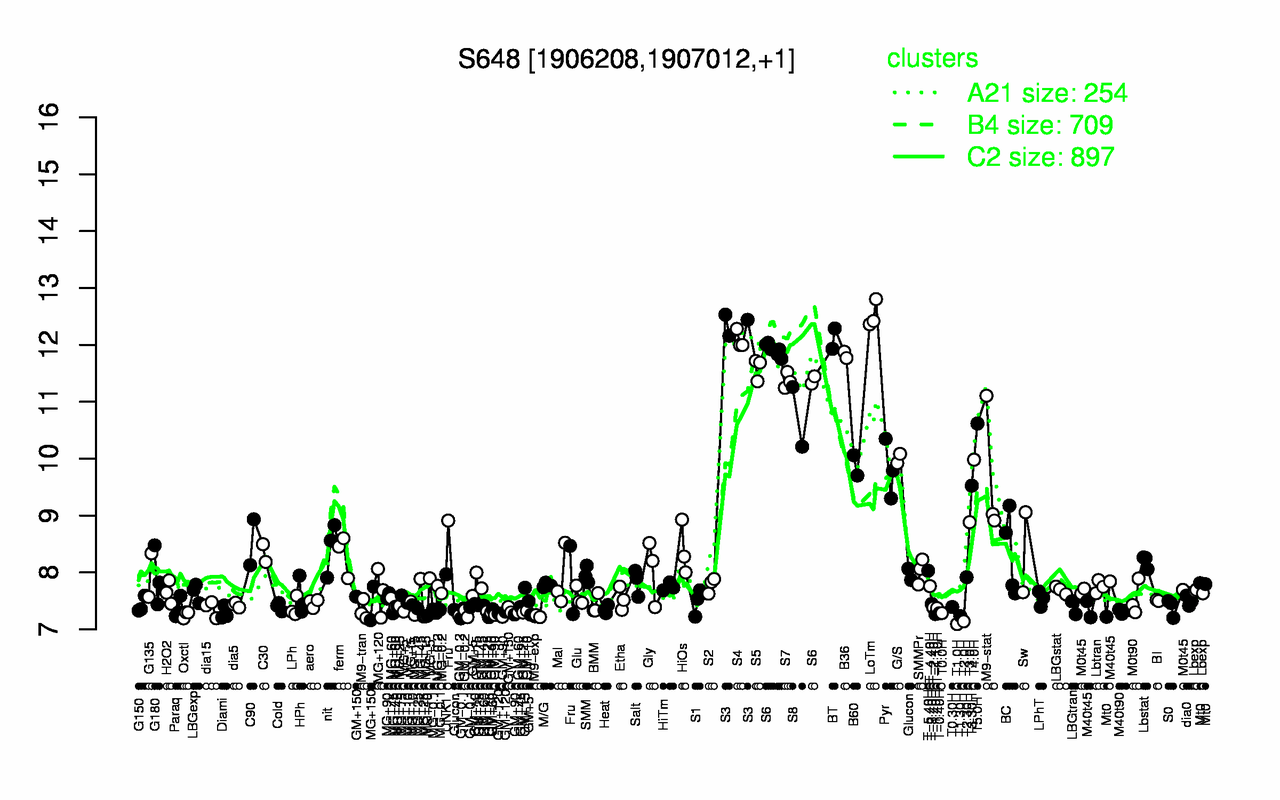
| LoTm | S3 | BT | S4 | B36 | S6 | S5 | S7 | S8 | T5.0H |
| 12.5 | 12.4 | 12.1 | 12.1 | 11.8 | 11.8 | 11.6 | 11.4 | 10.7 | 10.6 |
| T1.0H | T2.0H | M9-exp | T1.30H | GM+90 | Oxctl | GM-0.2 | T-1.40H | T-0.40H | T0.0H |
| 7.09 | 7.14 | 7.23 | 7.23 | 7.24 | 7.26 | 7.27 | 7.27 | 7.29 | 7.29 |