| Start Page |
|
 |
| Start Page |
|
|
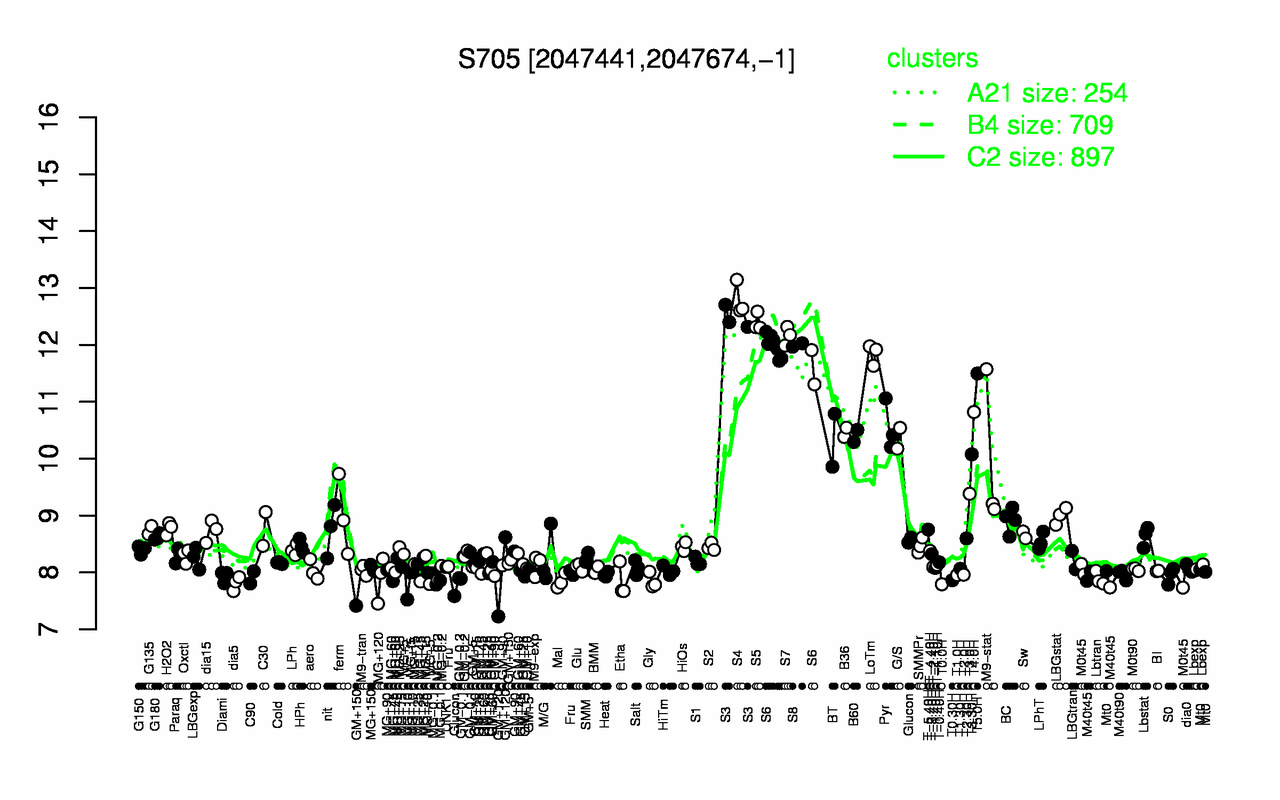
| S4 | S3 | S5 | S7 | S8 | S6 | LoTm | T5.0H | T4.0H | Pyr |
| 12.8 | 12.5 | 12.4 | 12.2 | 12 | 11.9 | 11.8 | 11.5 | 10.8 | 10.6 |
| T0.0H | dia5 | MG+10 | Mal | Etha | Gly | T0.30H | M40t45 | MG-0.1 | Lbtran |
| 7.79 | 7.81 | 7.84 | 7.85 | 7.85 | 7.85 | 7.86 | 7.87 | 7.88 | 7.89 |