| Start Page |
|
 |
| Start Page |
|
|
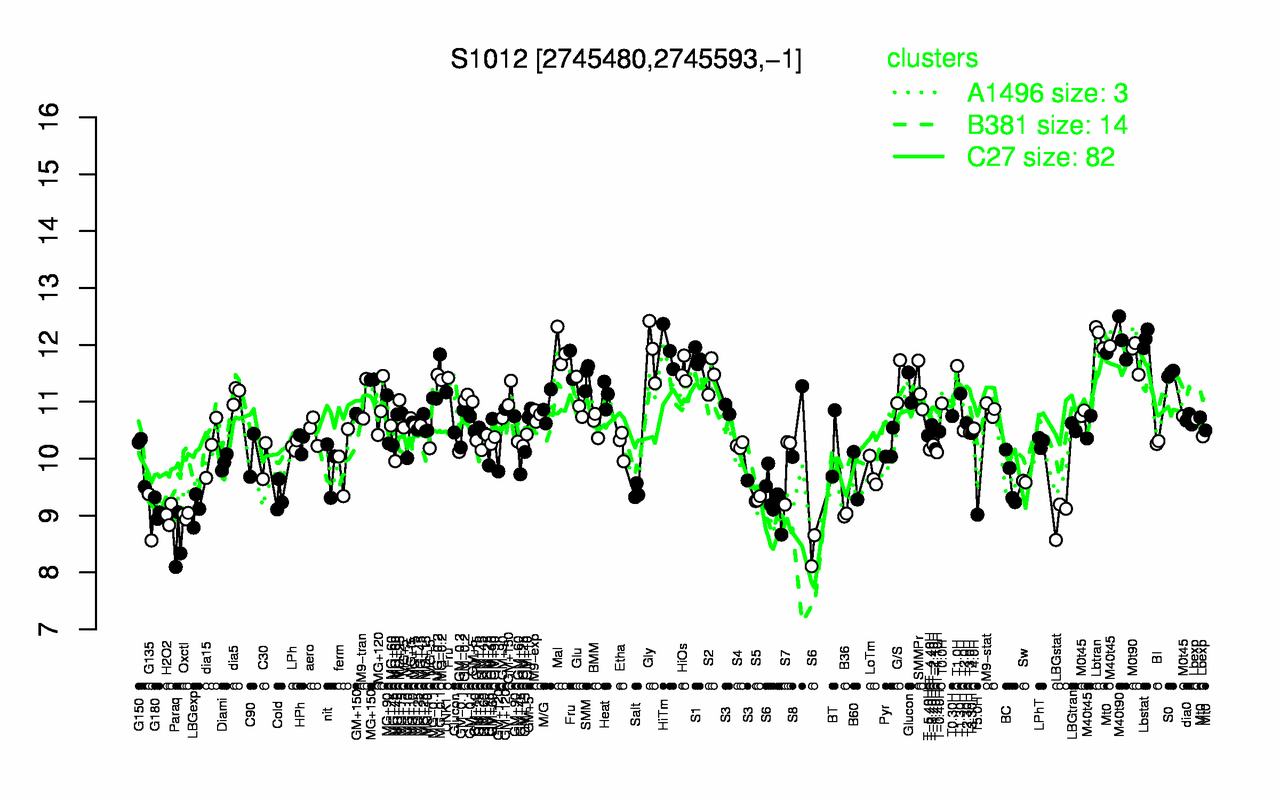
| Lbtran | M40t90 | Lbstat | HiTm | Mal | Gly | M0t90 | S1 | T1.0H | Fru |
| 12.2 | 12.1 | 12.1 | 11.9 | 11.9 | 11.9 | 11.8 | 11.8 | 11.6 | 11.6 |
| Paraq | LBGstat | G135 | Oxctl | B36 | T5.0H | H2O2 | S6 | LBGexp | G180 |
| 8.5 | 8.96 | 8.97 | 9 | 9.01 | 9.02 | 9.02 | 9.09 | 9.09 | 9.11 |