B. subtilis Expression Data Browser
Start Page
B. subtilis Expression Data Browser
Gene/Segment:
S1017
Locus Tag:
new_2756227_2756311
Details about S1017
Show/Hide
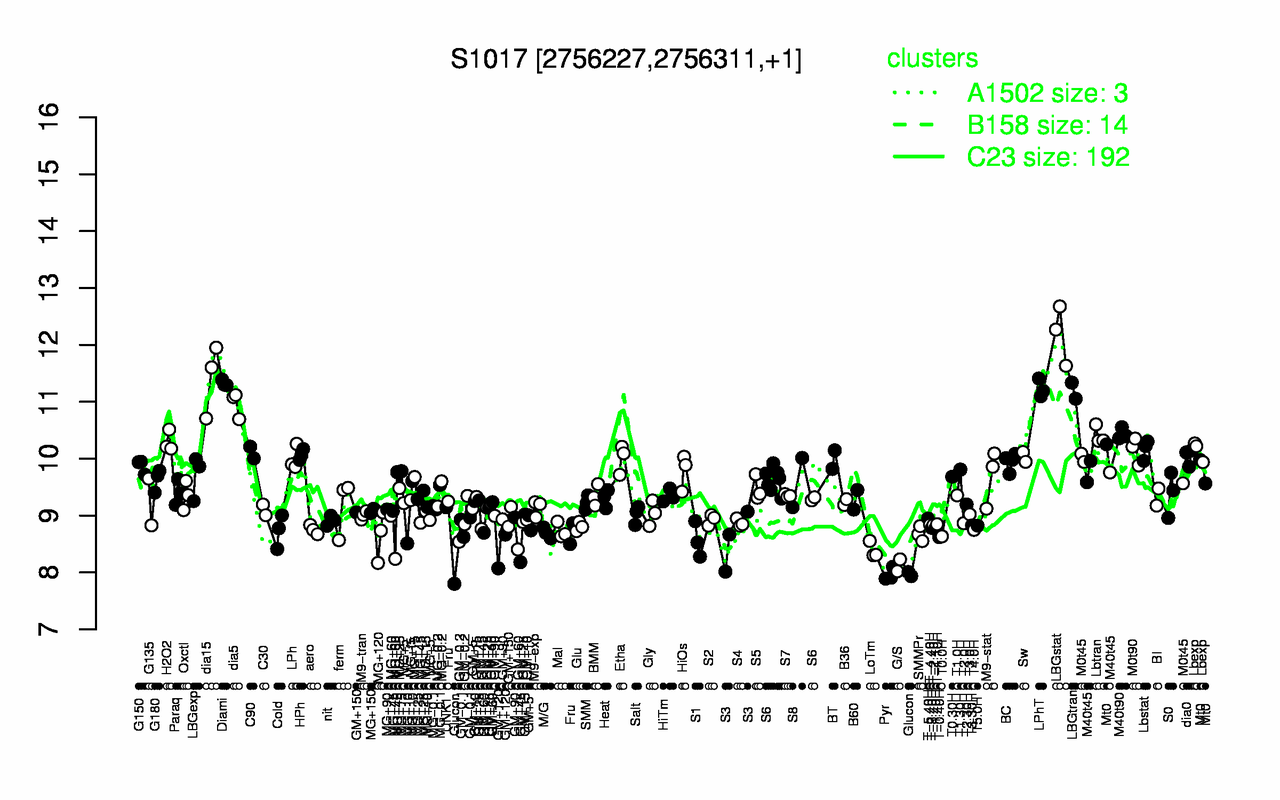
Highest Expression Conditions
LBGstat
dia15
Diami
LPhT
LBGtran
dia5
M40t90
Lbtran
H2O2
Lbstat
12.2
11.4
11.3
11.2
11.2
11
10.4
10.4
10.3
10.2
Lowest Expression Conditions
Glucon
Pyr
G/S
GM+120
LoTm
S1
S3
MG+60
T-0.40H
T0.0H
7.91
7.97
8.13
8.37
8.39
8.57
8.58
8.62
8.62
8.63
Most Positively Correlated Segments
adhA
yraB
nfrA
ywcH
yqjM
S154
yusQ
ydbP
S267
yqxG
0.88
0.83
0.74
0.74
0.73
0.73
0.73
0.73
0.71
0.71
Most Negatively Correlated Segments
opuBD
opuBB
opuBA
artP
opuBC
S909
opuCD
opuCA
nadB
argH
-0.72
-0.71
-0.7
-0.69
-0.68
-0.68
-0.67
-0.67
-0.67
-0.67
Expression Profile of Segment S1017
Show/Hide
Genomic View of Gene/Segment S1017
Show/Hide
(Legend)
Browse Genome Context