B. subtilis Expression Data Browser
Start Page
B. subtilis Expression Data Browser
Gene/Segment:
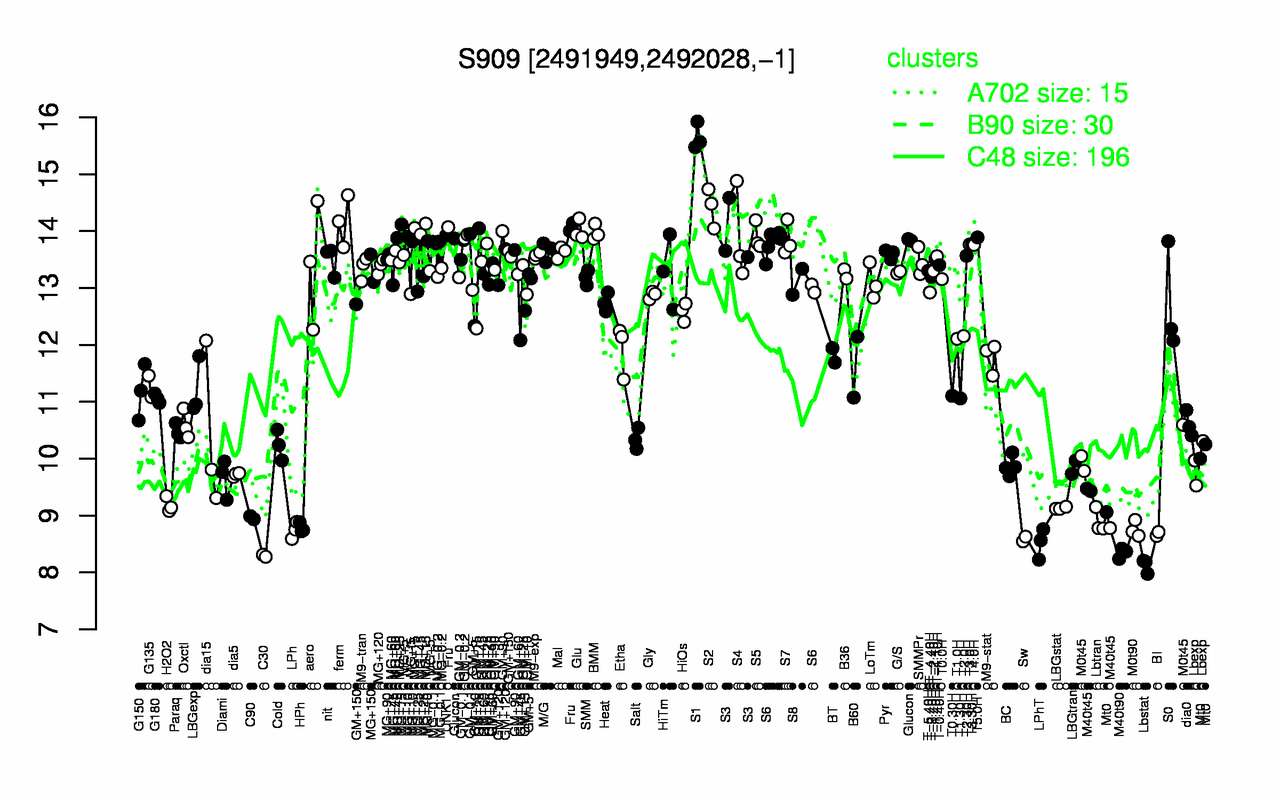
S909
Locus Tag:
new_2491949_2492028_c
Details about S909
Show/Hide
Highest Expression Conditions
S1
S2
ferm
MG+15
Fru
Glu
BMM
S3
UNK1
S5
15.7
14.4
14.2
14.1
14.1
14
14
13.9
13.9
13.9
Lowest Expression Conditions
Lbstat
C30
M40t90
LPhT
Sw
BI
LPh
M0t90
HPh
Lbtran
8.12
8.29
8.34
8.52
8.59
8.68
8.74
8.76
8.78
8.9
Most Positively Correlated Segments
artP
artQ
artR
argG
argH
argC
argJ
argB
argD
carA
0.99
0.98
0.95
0.95
0.93
0.93
0.91
0.89
0.89
0.88
Most Negatively Correlated Segments
perR
dnaE
yusQ
yvjA
crh
yvcN
ohrR
yvdS
whiA
yvcJ
-0.76
-0.75
-0.74
-0.74
-0.72
-0.72
-0.72
-0.71
-0.71
-0.71
Expression Profile of Segment S909
Show/Hide
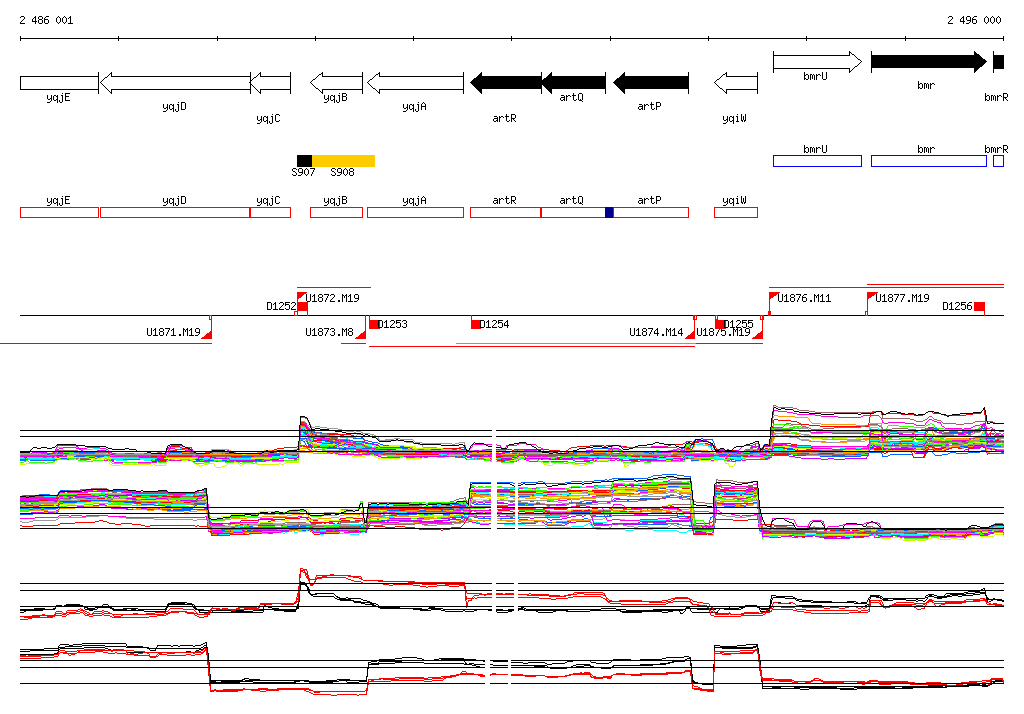
Genomic View of Gene/Segment S909
Show/Hide
(Legend)
Browse Genome Context