| Start Page |
|
 |
| Start Page |
|
|
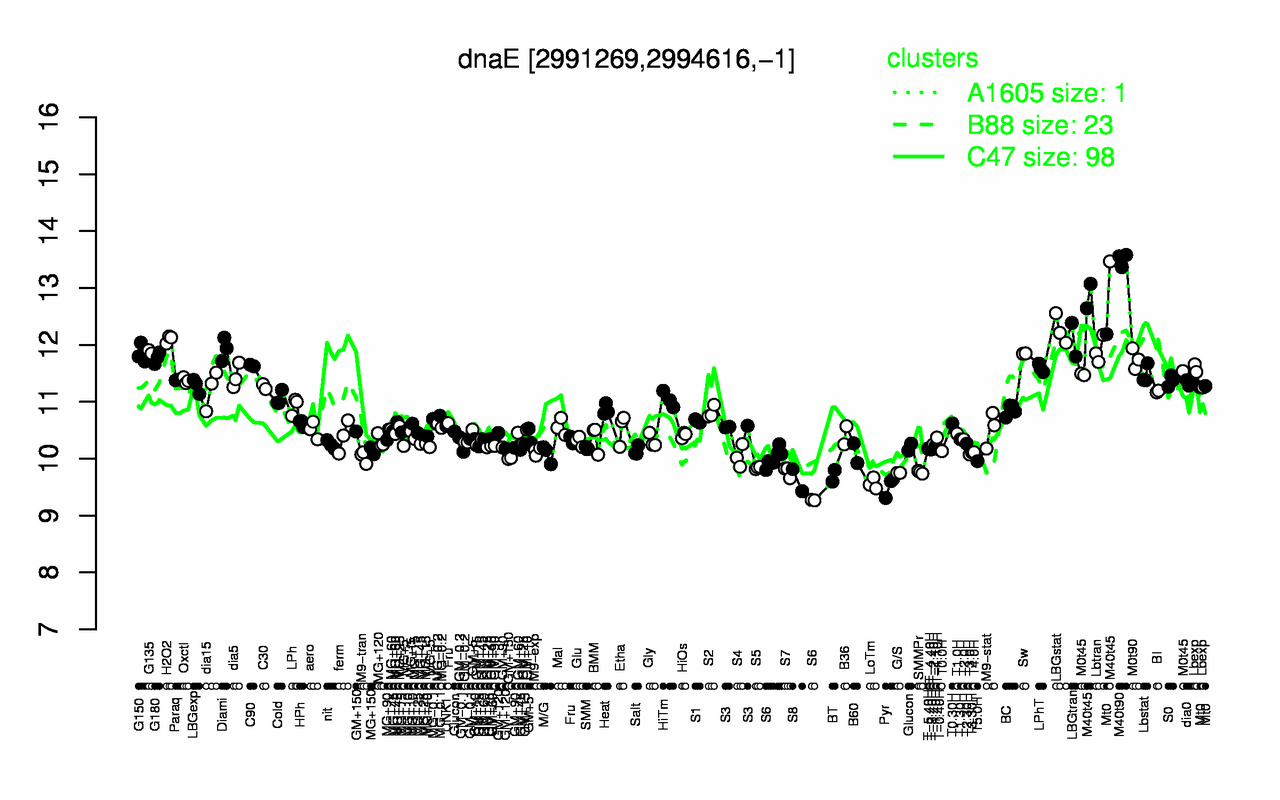
| M40t90 | M40t45 | LBGstat | H2O2 | LBGtran | Diami | Lbtran | G135 | G150 | Sw |
| 13.5 | 13.1 | 12.3 | 12.1 | 12.1 | 11.9 | 11.9 | 11.9 | 11.8 | 11.8 |
| Pyr | LoTm | S8 | BT | G/S | SMMPr | S7 | S5 | S6 | T5.0H |
| 9.52 | 9.56 | 9.62 | 9.7 | 9.75 | 9.76 | 9.77 | 9.84 | 9.84 | 9.96 |