B. subtilis Expression Data Browser
Start Page
B. subtilis Expression Data Browser
Gene/Segment:
S1056
Locus Tag:
new_2845839_2845914_c
Details about S1056
Show/Hide
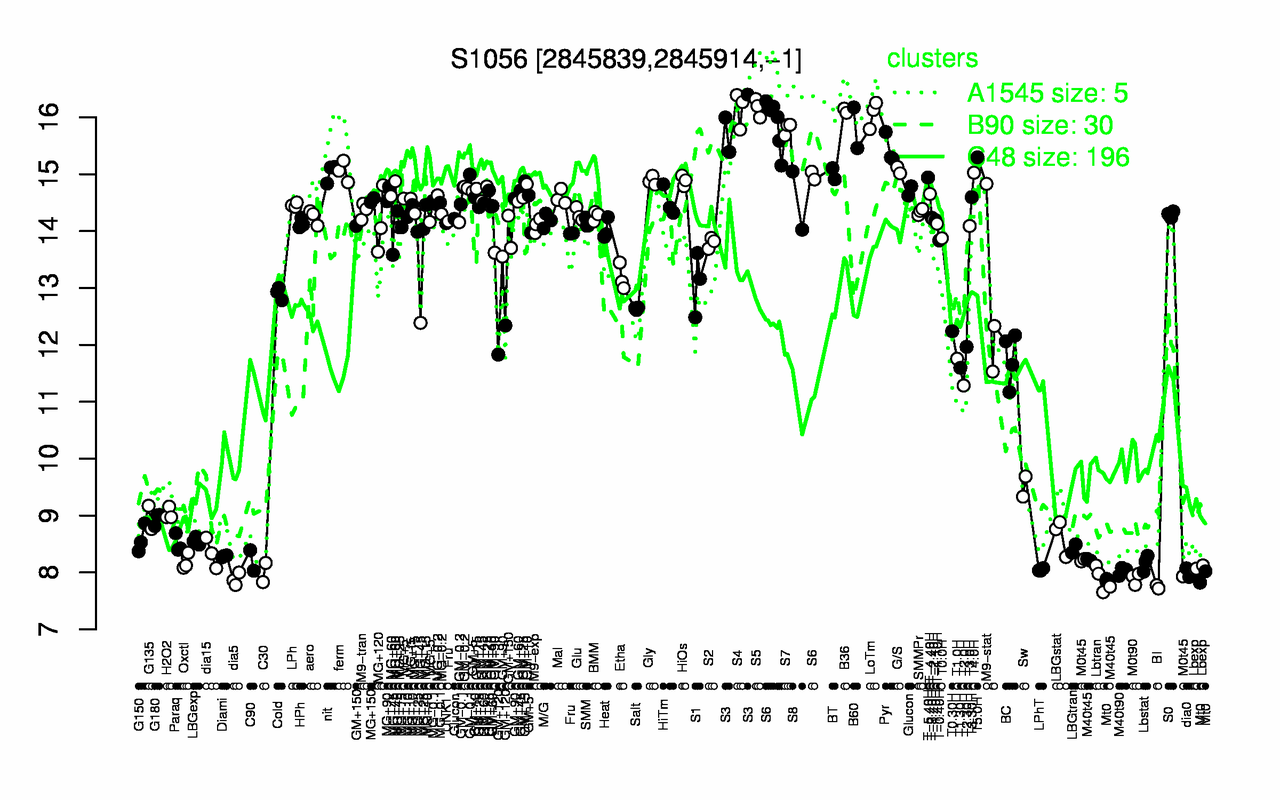
Highest Expression Conditions
S5
S4
B36
LoTm
S3
B60
S7
S6
Pyr
T5.0H
16.2
16.1
16.1
16.1
15.9
15.8
15.8
15.7
15.4
15.3
Lowest Expression Conditions
BI
dia5
M0t90
Mt0
Lbtran
C30
dia0
M40t90
LPhT
M40t45
7.75
7.88
7.9
7.91
7.92
8
8.01
8.02
8.05
8.06
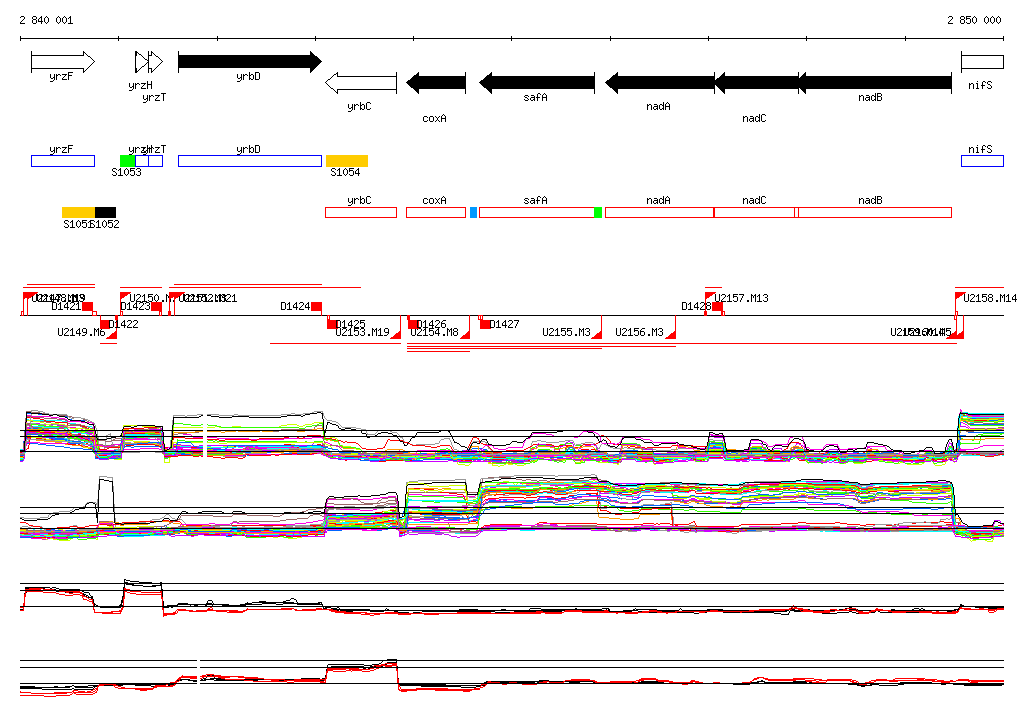
Most Positively Correlated Segments
safA
nadA
S1055
nadB
nadC
nifS
bioK
bioW
bioF
rapF
0.99
0.99
0.93
0.92
0.91
0.87
0.86
0.85
0.85
0.85
Most Negatively Correlated Segments
pbuE
yvjA
treA
dnaE
treP
treR
yttB
yusQ
ydiF
yvcJ
-0.89
-0.85
-0.85
-0.84
-0.82
-0.82
-0.81
-0.81
-0.8
-0.79
Expression Profile of Segment S1056
Show/Hide
Genomic View of Gene/Segment S1056
Show/Hide
(Legend)
Browse Genome Context