B. subtilis Expression Data Browser
Start Page
B. subtilis Expression Data Browser
Gene/Segment:
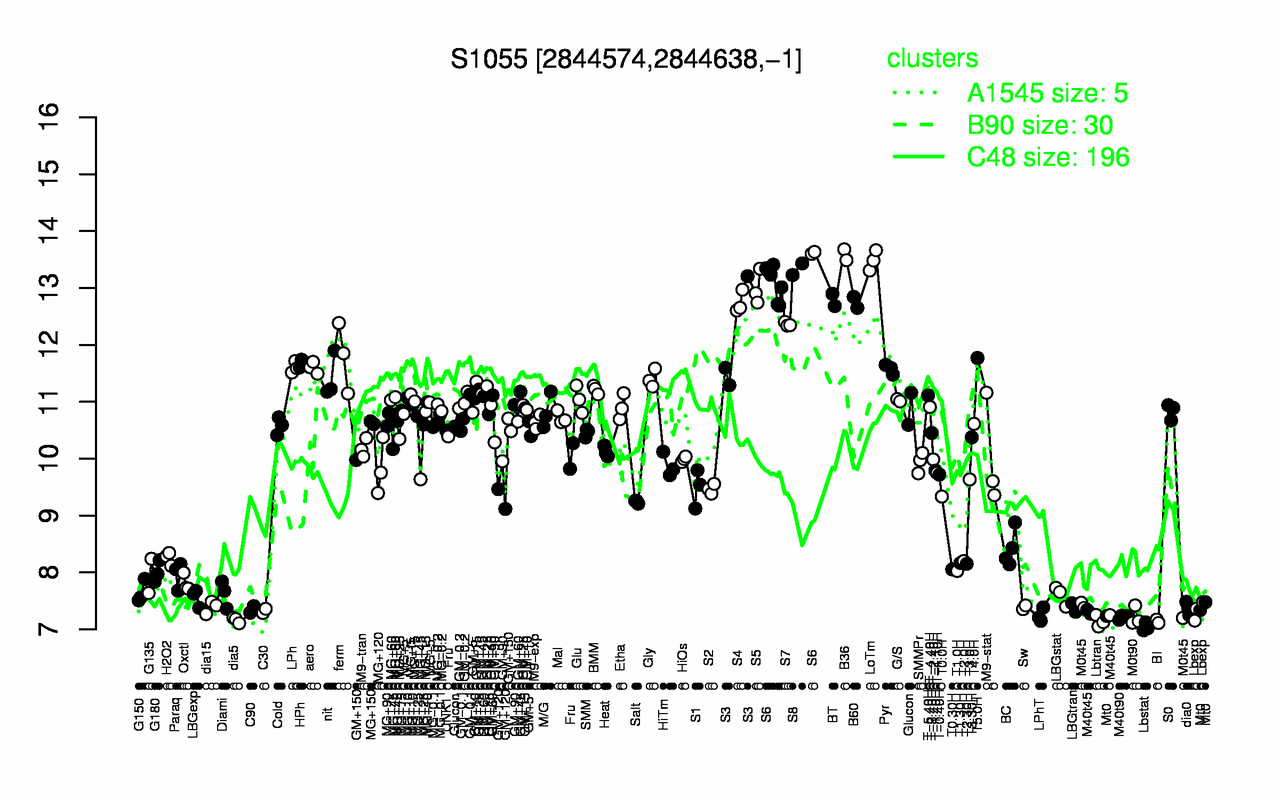
S1055
Locus Tag:
new_2844574_2844638_c
Details about S1055
Show/Hide
Highest Expression Conditions
B36
LoTm
S8
S6
S5
BT
B60
S4
S7
S3
13.6
13.5
13.3
13.2
13
12.8
12.7
12.7
12.4
12
Lowest Expression Conditions
Lbstat
BI
Lbtran
dia5
M40t90
M0t90
LPhT
M40t45
C30
Lbexp
7.04
7.14
7.14
7.16
7.21
7.23
7.25
7.29
7.32
7.33
Most Positively Correlated Segments
safA
S1056
coxA
nadA
nadB
nadC
S1451
ywhH
ylmC
ytbQ
0.94
0.93
0.93
0.9
0.81
0.78
0.77
0.76
0.76
0.75
Most Negatively Correlated Segments
ydiF
yvjA
yrvN
dnaE
yusQ
yfmR
pbuE
yfiC
yhdI
ydfE
-0.81
-0.8
-0.79
-0.79
-0.78
-0.78
-0.78
-0.78
-0.78
-0.78
Expression Profile of Segment S1055
Show/Hide
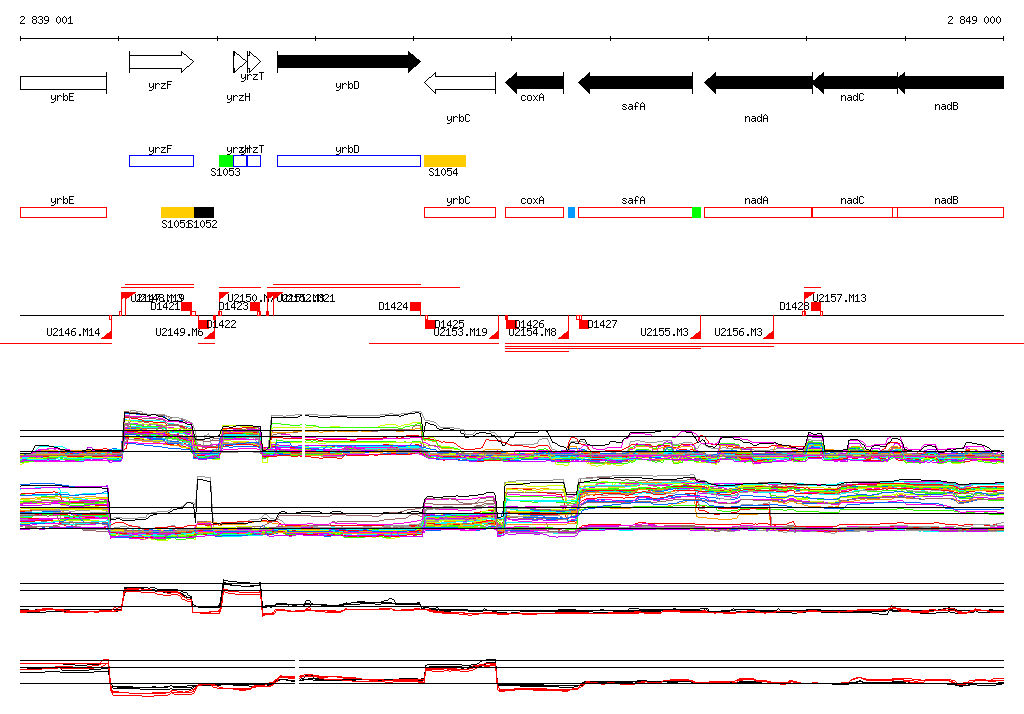
Genomic View of Gene/Segment S1055
Show/Hide
(Legend)
Browse Genome Context