| Start Page |
|
 |
| Start Page |
|
|
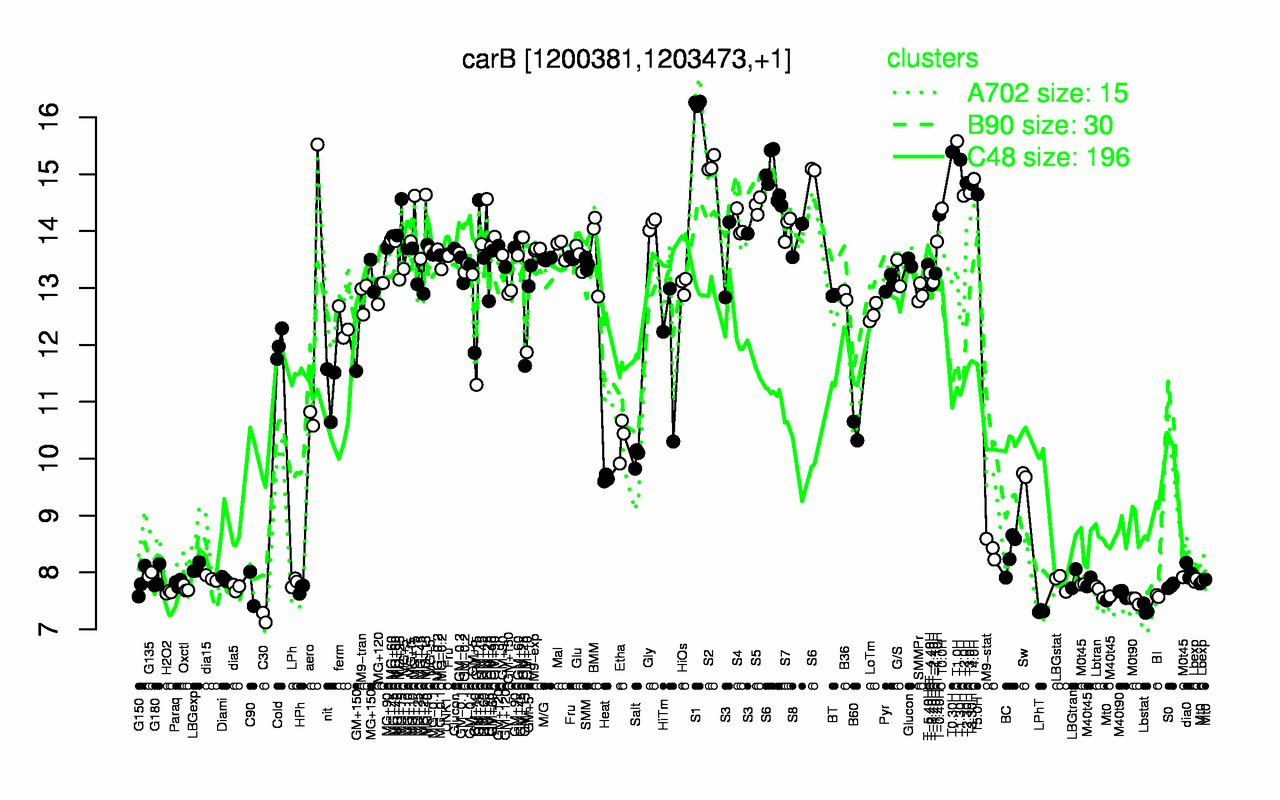
| S1 | T1.0H | T0.30H | T1.30H | S2 | S6 | T4.0H | T2.30H | T3.30H | T3.0H |
| 16.2 | 15.6 | 15.4 | 15.3 | 15.2 | 14.9 | 14.9 | 14.8 | 14.8 | 14.7 |
| C30 | LPhT | Lbstat | M0t90 | BI | M40t90 | H2O2 | Lbtran | C90 | HPh |
| 7.21 | 7.32 | 7.35 | 7.51 | 7.59 | 7.63 | 7.65 | 7.67 | 7.71 | 7.72 |