| Start Page |
|
 |
| Start Page |
|
|
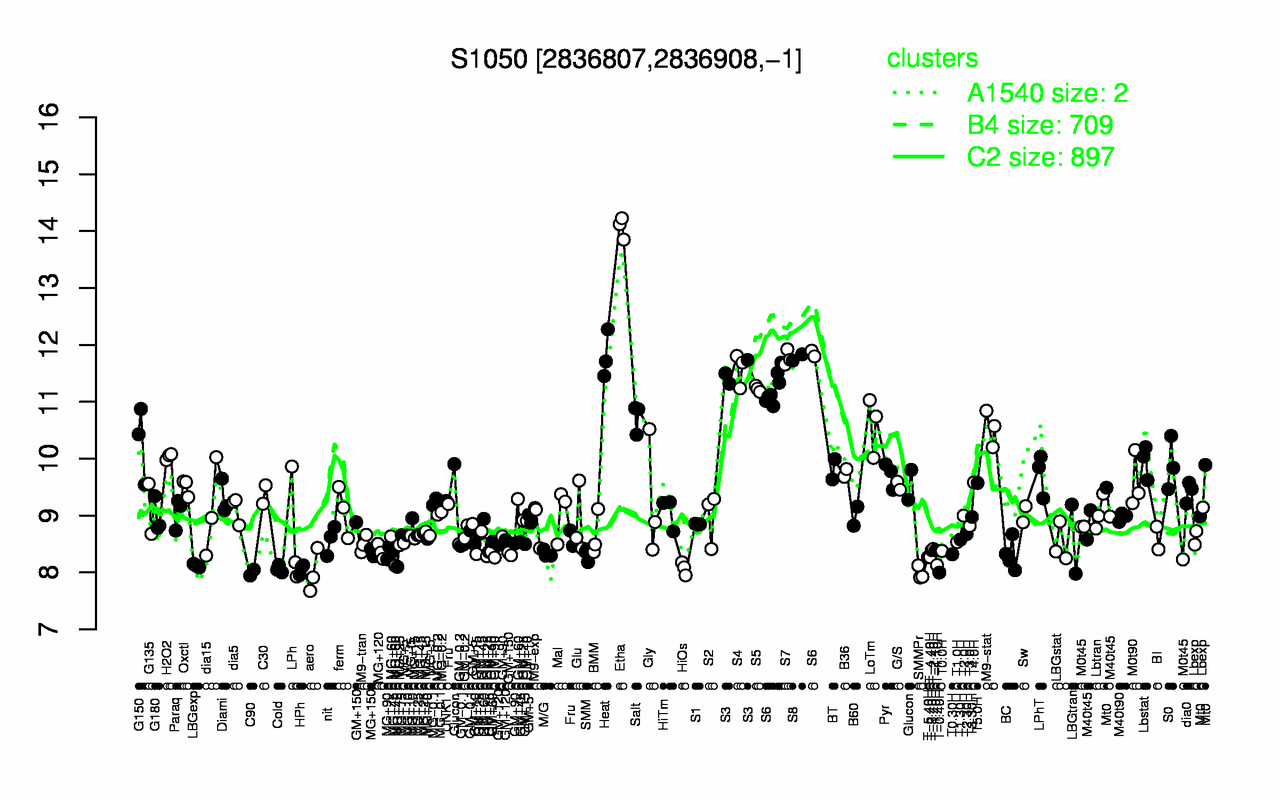
| Etha | Heat | S8 | S7 | S4 | S3 | S6 | S5 | Salt | LoTm |
| 14.1 | 11.8 | 11.8 | 11.8 | 11.6 | 11.5 | 11.4 | 11.2 | 10.7 | 10.6 |
| SMMPr | C90 | T-0.40H | aero | HPh | Cold | HiOs | LBGexp | T-1.10H | T-5.40H |
| 7.99 | 8 | 8 | 8.01 | 8.06 | 8.06 | 8.07 | 8.12 | 8.13 | 8.27 |