B. subtilis Expression Data Browser
Start Page
B. subtilis Expression Data Browser
Gene/Segment:
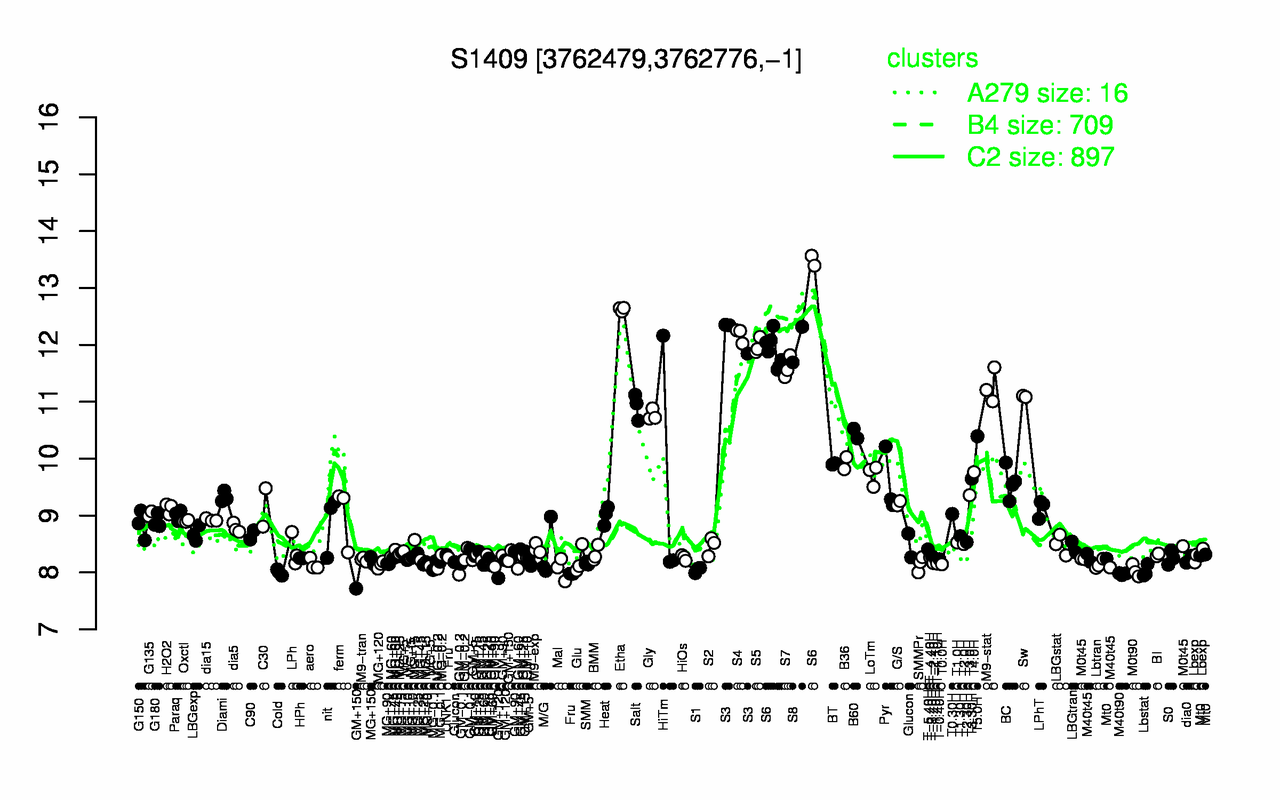
S1409
Locus Tag:
new_3762479_3762776_c
Details about S1409
Show/Hide
Highest Expression Conditions
Etha
S6
S3
S4
S8
S5
S7
M9-stat
Sw
Salt
12.6
12.2
12.2
12.2
12
12
11.6
11.3
11.1
10.9
Lowest Expression Conditions
M40t90
Cold
Lbstat
M0t90
S1
Mal
GM+120
Fru
GM+150
GM+60
7.98
8
8.02
8.03
8.04
8.06
8.06
8.07
8.1
8.11
Most Positively Correlated Segments
S749
yojJ
yfhE
S1136
ywlB
yaaH
yhcM
S1279
yckC
yfkD
0.94
0.93
0.91
0.91
0.9
0.9
0.87
0.87
0.87
0.86
Most Negatively Correlated Segments
ezrA
yugH
ykqA
yugG
kinC
S567
S1437
nosA
dnaA
minJ
-0.82
-0.82
-0.82
-0.82
-0.8
-0.8
-0.8
-0.8
-0.79
-0.79
Expression Profile of Segment S1409
Show/Hide
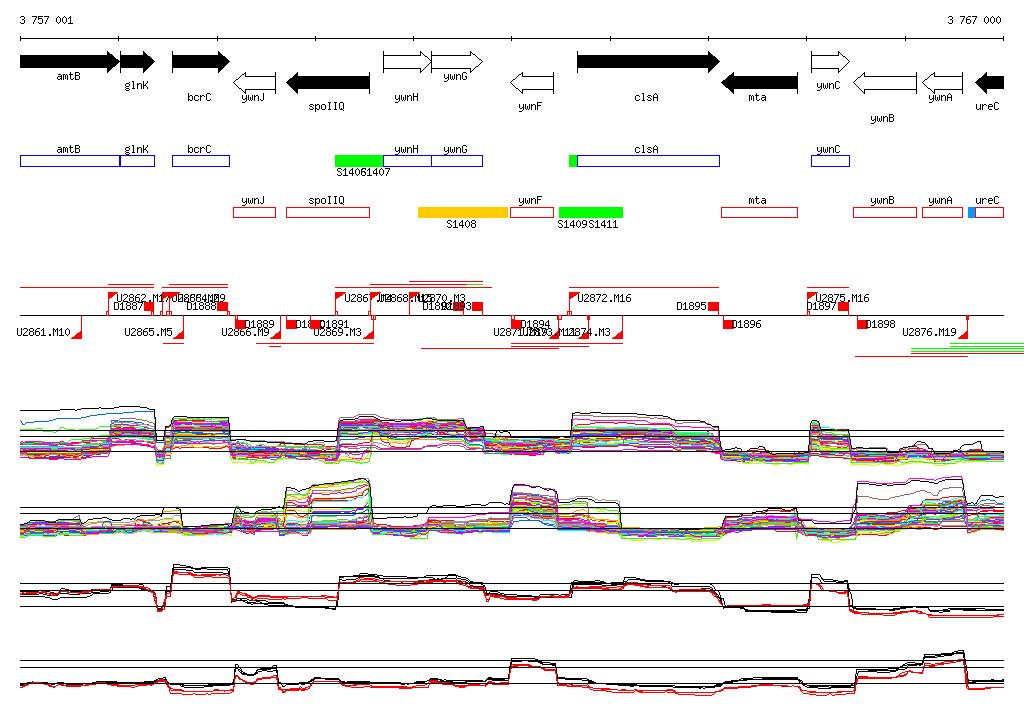
Genomic View of Gene/Segment S1409
Show/Hide
(Legend)
Browse Genome Context