| Start Page |
|
 |
| Start Page |
|
|
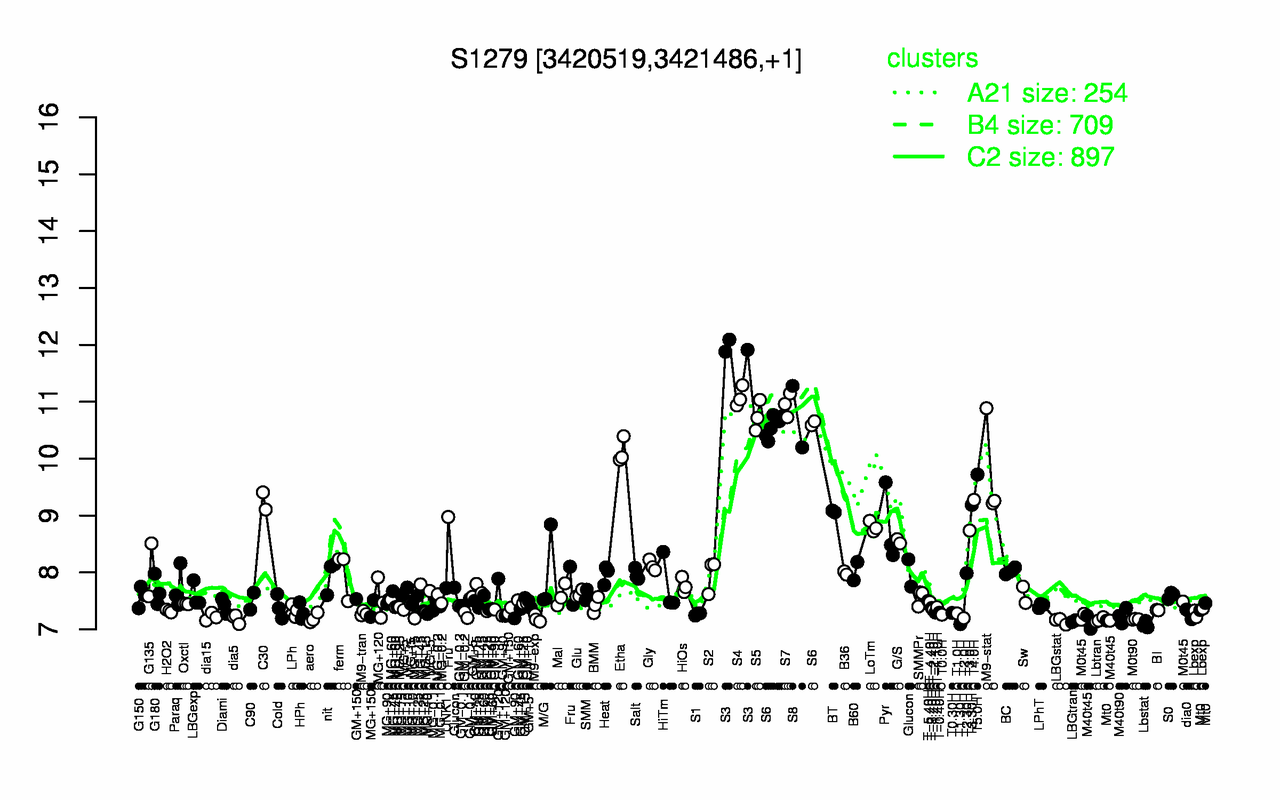
| S3 | S4 | S7 | S5 | S8 | S6 | Etha | M9-stat | T5.0H | T4.0H |
| 12 | 11.1 | 10.9 | 10.7 | 10.7 | 10.6 | 10.1 | 9.79 | 9.72 | 9.28 |
| Lbstat | T1.30H | M40t45 | LBGtran | LBGstat | Lbtran | M0t90 | dia5 | M9-exp | T2.0H |
| 7.08 | 7.09 | 7.13 | 7.14 | 7.14 | 7.17 | 7.18 | 7.19 | 7.19 | 7.2 |