B. subtilis Expression Data Browser
Start Page
B. subtilis Expression Data Browser
Gene/Segment:
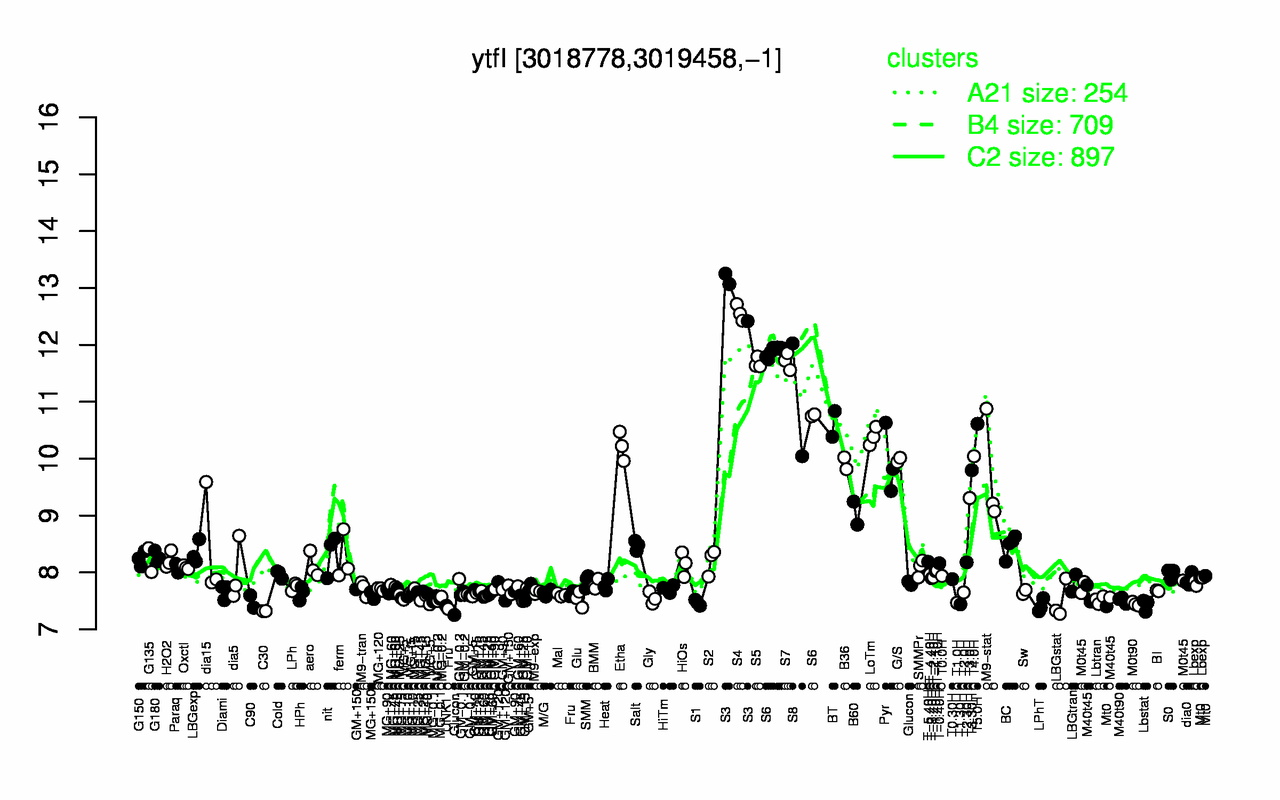
ytfI
Locus Tag:
BSU29510
Details about ytfI
Show/Hide
Highest Expression Conditions
S3
S4
S7
S5
S6
S8
T5.0H
BT
LoTm
Etha
12.9
12.6
11.7
11.7
11.6
11
10.6
10.6
10.4
10.2
Lowest Expression Conditions
C30
LPhT
UNK1
Lbstat
T1.30H
M0t90
T1.0H
S1
MG+5
C90
7.32
7.41
7.41
7.43
7.44
7.45
7.47
7.47
7.48
7.49
Most Positively Correlated Segments
lonB
ymxH
S597
yqxA
glsB
ymaF
spoIIP
glnH
glnQ
glnM
0.97
0.95
0.95
0.95
0.94
0.94
0.94
0.94
0.94
0.94
Most Negatively Correlated Segments
S1406
yugH
sbcD
addA
yeaD
sbcC
kinC
S378
yeaC
addB
-0.87
-0.85
-0.85
-0.85
-0.85
-0.84
-0.84
-0.84
-0.84
-0.84
Expression Profile of Segment ytfI
Show/Hide
Annotation of Gene ytfI
Show/Hide
inference
ab initio prediction:AMIGene:2.0
codon_start
1
product
conserved hypothetical protein
transl_table
11
note
Evidence 4: Homologs of previously reported genes of unknown function
db_xref
GI:2635435
protein_id
CAB14929.1
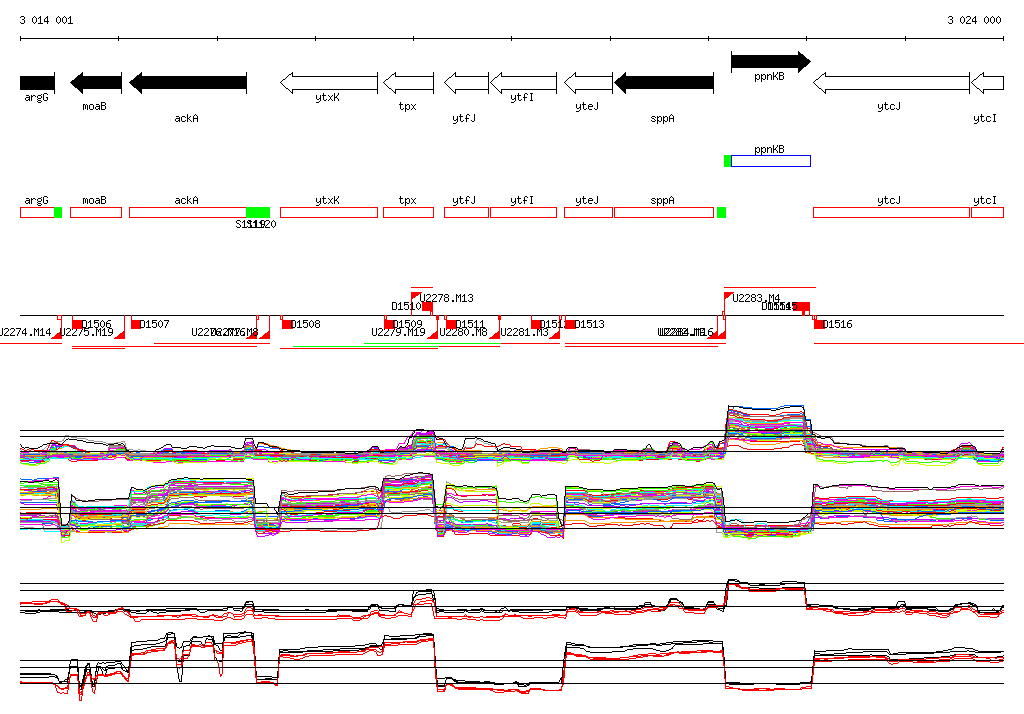
Genomic View of Gene/Segment ytfI
Show/Hide
(Legend)
Browse Genome Context