| Start Page |
|
 |
| Start Page |
|
|
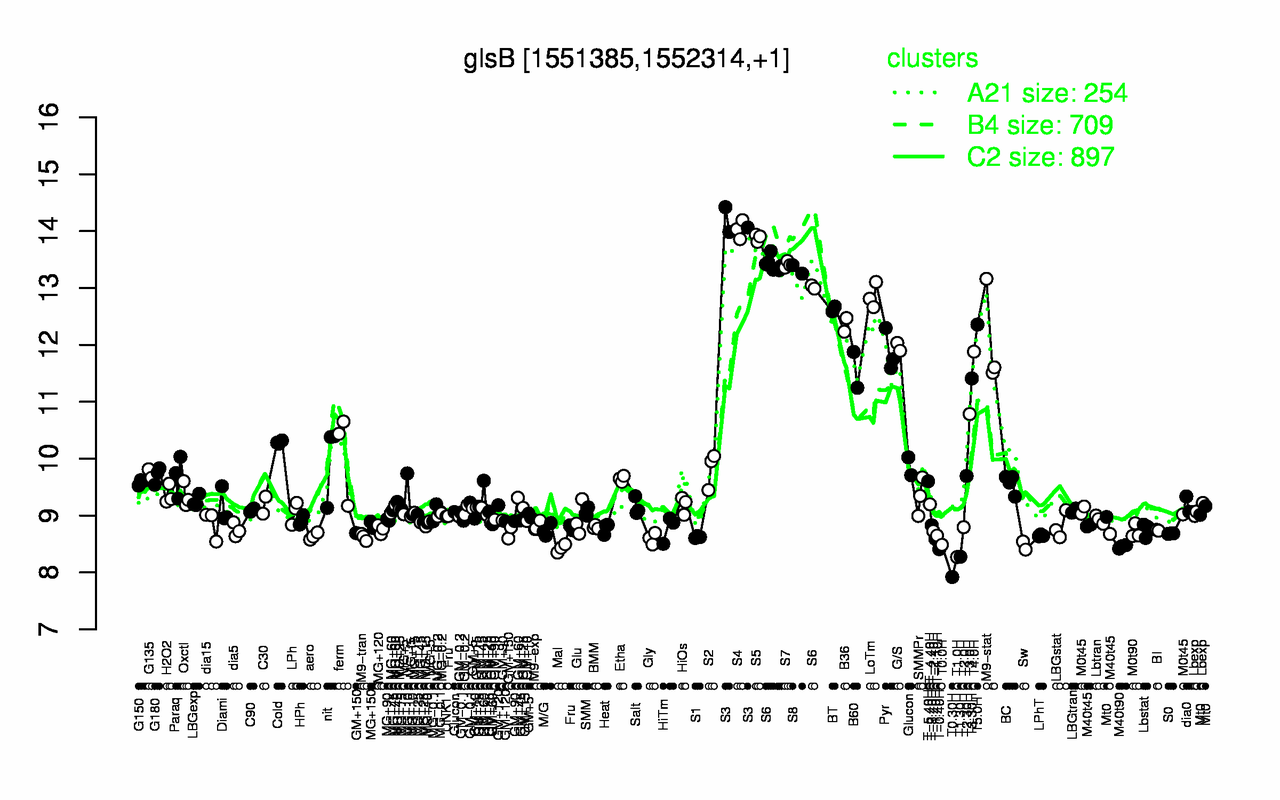
| S3 | S4 | S5 | S7 | S8 | S6 | LoTm | BT | T5.0H | B36 |
| 14.2 | 14 | 13.9 | 13.4 | 13.3 | 13.3 | 12.9 | 12.6 | 12.4 | 12.4 |
| T0.30H | T1.0H | T1.30H | T-0.40H | Mal | M40t90 | Sw | T0.0H | T-1.40H | Gly |
| 7.92 | 8.27 | 8.28 | 8.41 | 8.43 | 8.45 | 8.47 | 8.49 | 8.59 | 8.6 |