B. subtilis Expression Data Browser
Start Page
B. subtilis Expression Data Browser
Gene/Segment:
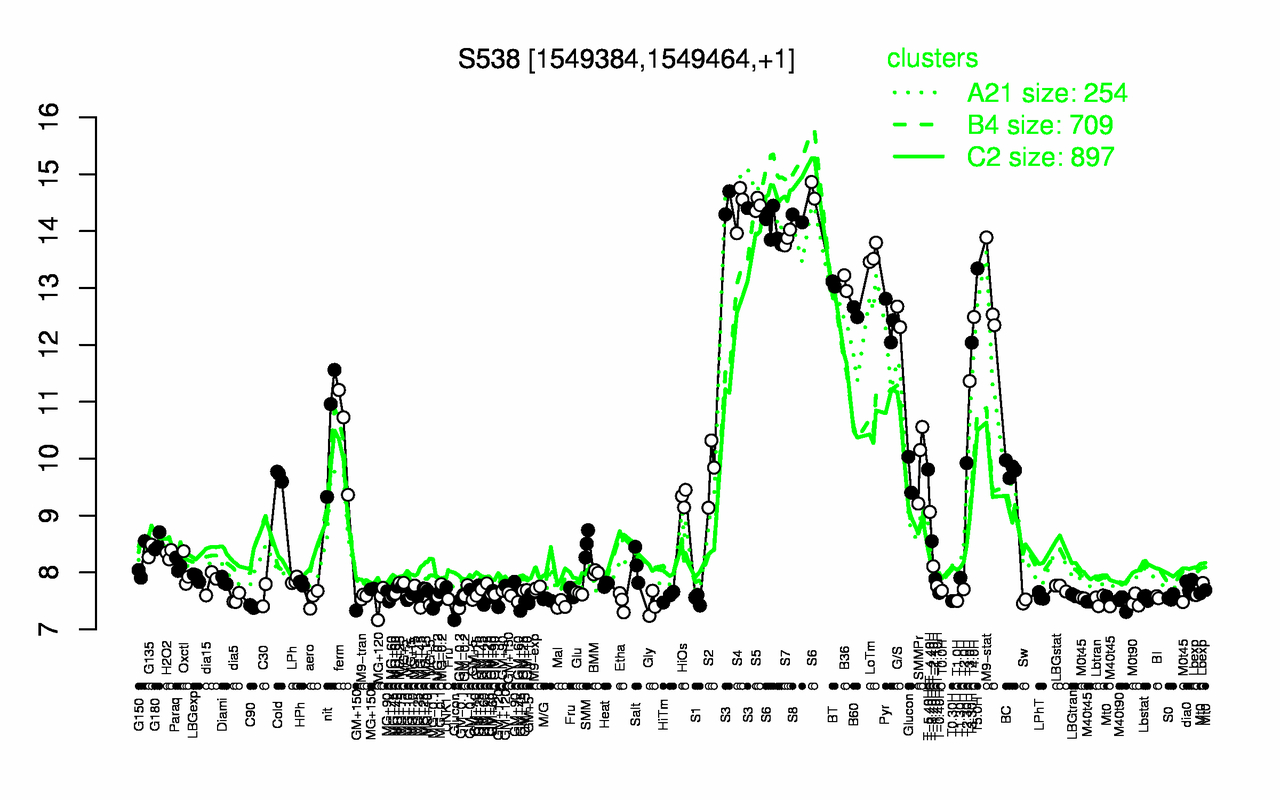
S538
Locus Tag:
new_1549384_1549464
Details about S538
Show/Hide
Highest Expression Conditions
S3
S5
S4
S8
S6
S7
LoTm
T5.0H
B36
BT
14.5
14.5
14.4
14.2
14.2
13.9
13.6
13.3
13.1
13.1
Lowest Expression Conditions
C90
Mal
Gly
M40t45
M40t90
Etha
Sw
MG+120
T0.30H
T1.0H
7.4
7.43
7.44
7.46
7.46
7.49
7.49
7.49
7.5
7.5
Most Positively Correlated Segments
ylaK
prkA
ysxE
spoIVA
yknT
spoVR
S647
cotO
cotJB
S246
0.99
0.98
0.98
0.98
0.98
0.98
0.98
0.98
0.97
0.97
Most Negatively Correlated Segments
sbcD
S378
sbcC
yvrG
addA
addB
sigD
S1129
yeaC
cheC
-0.9
-0.89
-0.88
-0.87
-0.87
-0.86
-0.85
-0.85
-0.85
-0.85
Expression Profile of Segment S538
Show/Hide
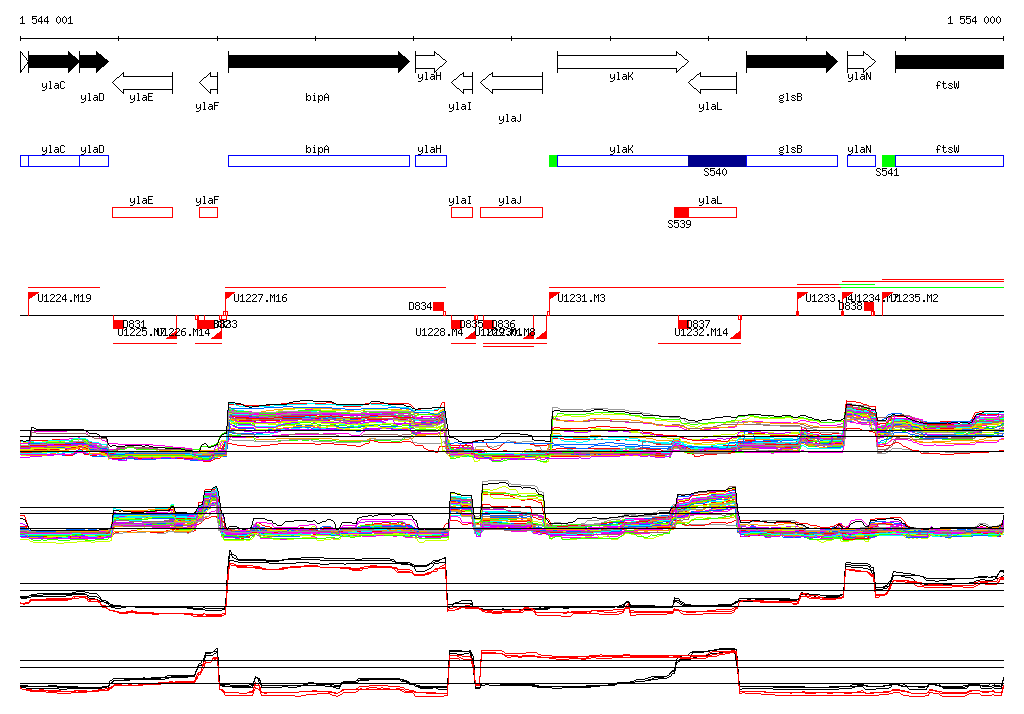
Genomic View of Gene/Segment S538
Show/Hide
(Legend)
Browse Genome Context