| Start Page |
|
 |
| Start Page |
|
|
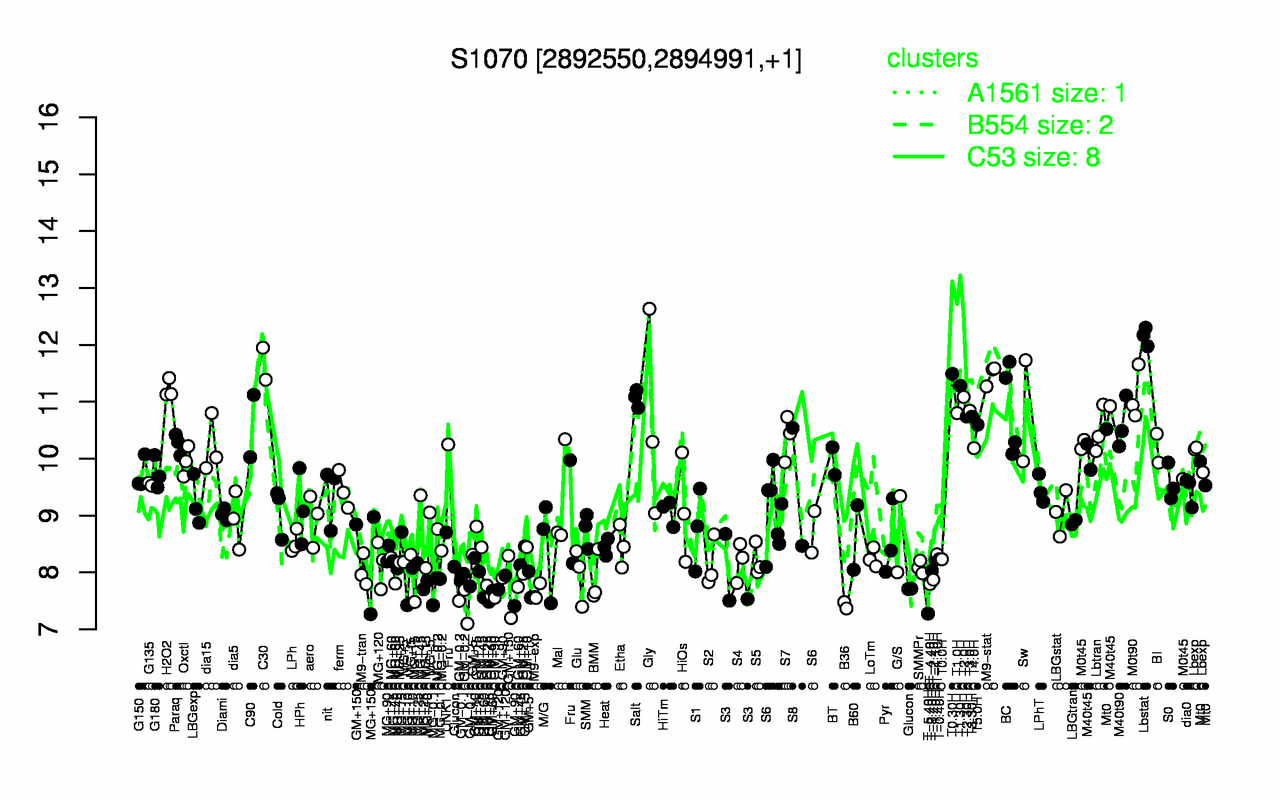
| Lbstat | C30 | T0.30H | M9-stat | T1.30H | H2O2 | M0t90 | T2.0H | Salt | BC |
| 12.1 | 11.7 | 11.5 | 11.5 | 11.3 | 11.2 | 11.1 | 11.1 | 11.1 | 10.9 |
| T-5.40H | B36 | GM-0.2 | GM+90 | M9-exp | GM+60 | MG-0.1 | MG+10 | T-4.40H | GM+120 |
| 7.28 | 7.42 | 7.43 | 7.62 | 7.64 | 7.66 | 7.74 | 7.78 | 7.8 | 7.82 |