| Start Page |
|
 |
| Start Page |
|
|
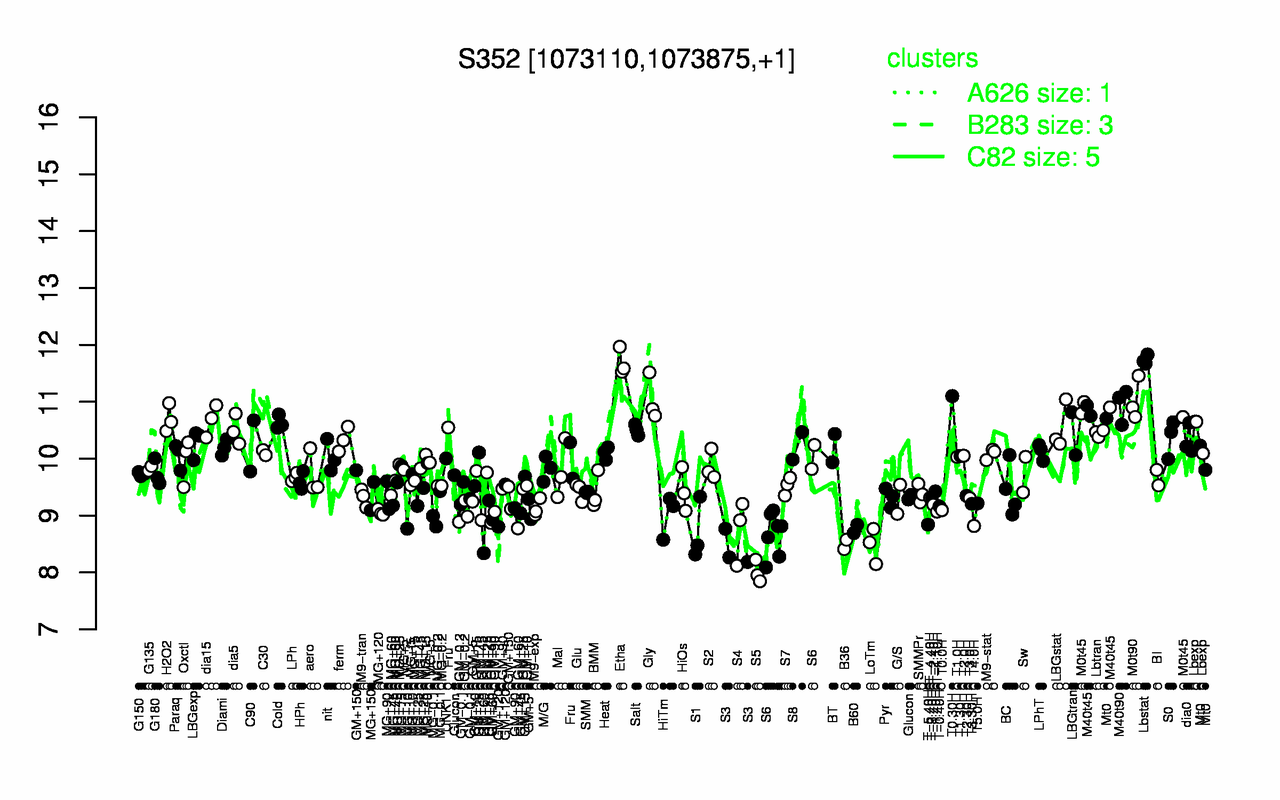
| Lbstat | Etha | T0.30H | Gly | M0t90 | M40t90 | M40t45 | M0t45 | H2O2 | dia15 |
| 11.7 | 11.7 | 11.1 | 11 | 11 | 10.9 | 10.9 | 10.8 | 10.7 | 10.7 |
| S5 | S3 | LoTm | B36 | GM+60 | S1 | S4 | B60 | T4.0H | T-5.40H |
| 8.01 | 8.4 | 8.48 | 8.49 | 8.68 | 8.71 | 8.75 | 8.76 | 8.82 | 8.84 |