B. subtilis Expression Data Browser
Start Page
B. subtilis Expression Data Browser
Gene/Segment:
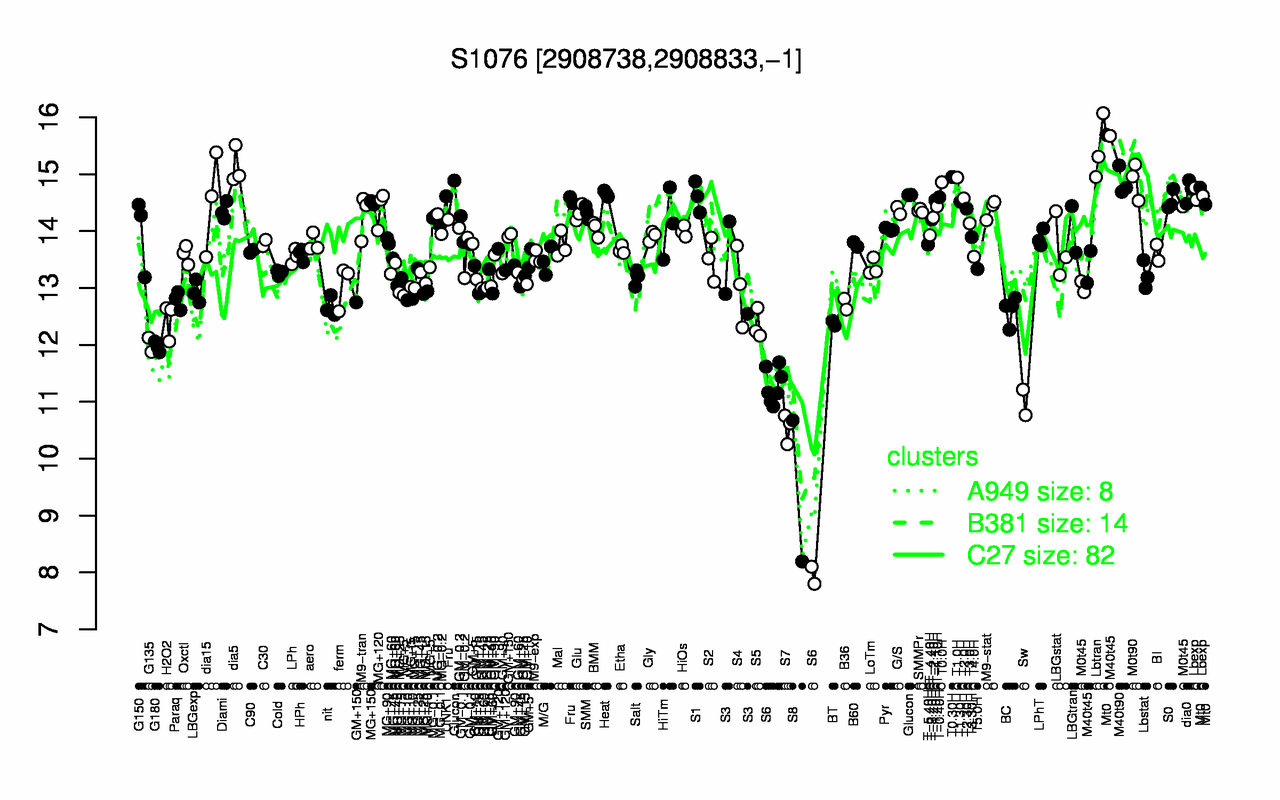
S1076
Locus Tag:
new_2908738_2908833_c
Details about S1076
Show/Hide
Highest Expression Conditions
Lbtran
dia5
Mt0
T0.30H
T1.0H
M0t90
M40t90
T0.0H
Glucon
dia0
15.4
15.1
15
15
14.9
14.9
14.9
14.9
14.7
14.7
Lowest Expression Conditions
S8
S6
S7
Sw
G180
G135
S5
BT
H2O2
BC
9.43
10.5
10.5
11
12
12
12.4
12.4
12.4
12.6
Most Positively Correlated Segments
sdhC
sdhA
odhA
sucC
sdhB
odhB
sucD
gudB
parA
yusH
0.97
0.89
0.87
0.83
0.81
0.79
0.79
0.78
0.77
0.76
Most Negatively Correlated Segments
yqjB
helD
yqeC
yqjC
S1573
pdaA
S422
ycgI
S1433
yueG
-0.74
-0.73
-0.73
-0.73
-0.72
-0.72
-0.71
-0.71
-0.71
-0.71
Expression Profile of Segment S1076
Show/Hide
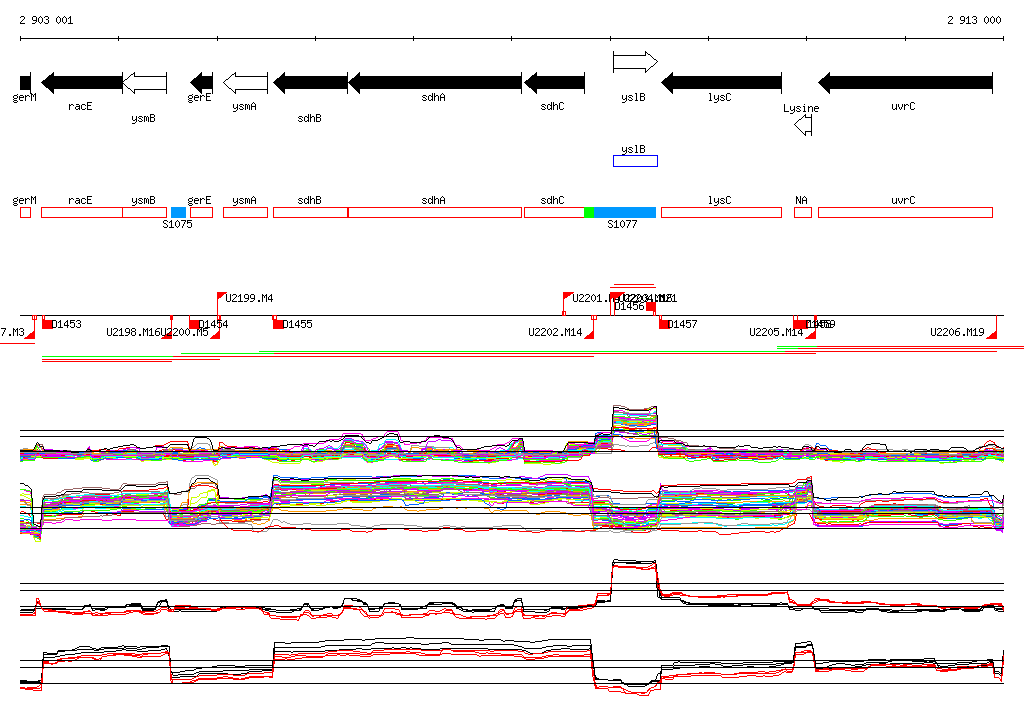
Genomic View of Gene/Segment S1076
Show/Hide
(Legend)
Browse Genome Context