| Start Page |
|
 |
| Start Page |
|
|
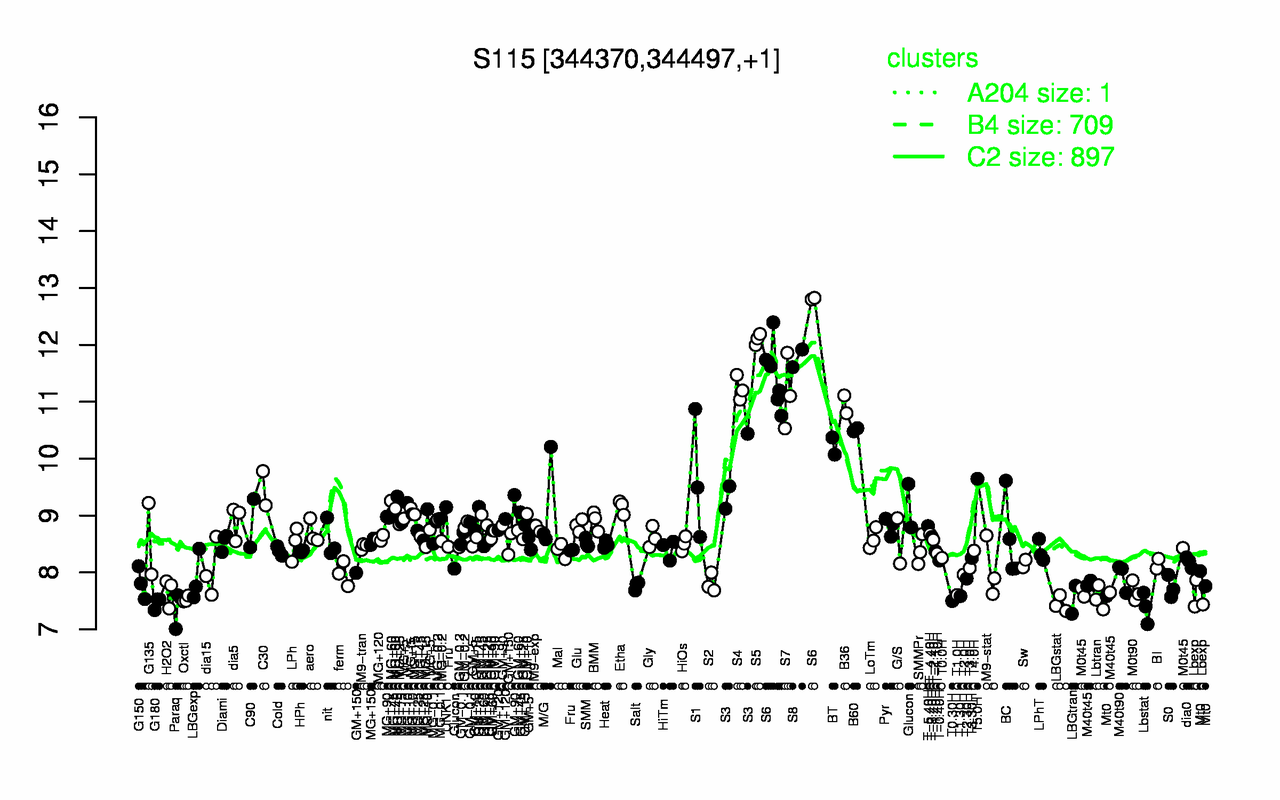
| S5 | S6 | S8 | S4 | S7 | B36 | B60 | BT | S3 | S1 |
| 12.1 | 11.8 | 11.8 | 11.2 | 11.2 | 11 | 10.5 | 10.2 | 9.69 | 9.66 |
| Lbstat | Paraq | LBGstat | G180 | T0.30H | LBGtran | Oxctl | Lbtran | Lbexp | T1.30H |
| 7.38 | 7.39 | 7.45 | 7.46 | 7.5 | 7.52 | 7.53 | 7.55 | 7.57 | 7.58 |