| Start Page |
|
 |
| Start Page |
|
|
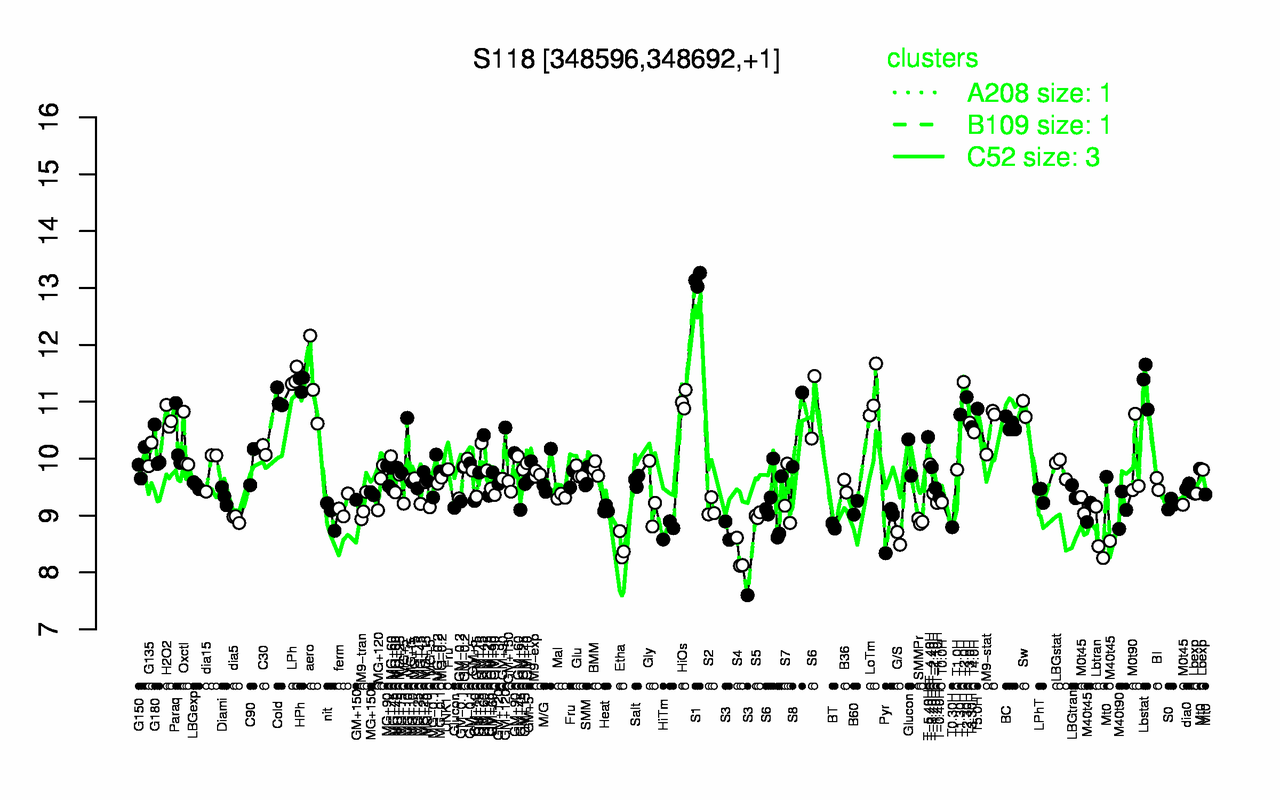
| S1 | LPh | T2.0H | HPh | aero | Lbstat | LoTm | T2.30H | Cold | HiOs |
| 13.1 | 11.4 | 11.3 | 11.3 | 11.3 | 11.3 | 11.1 | 11.1 | 11.1 | 11 |
| S4 | S3 | Etha | G/S | Lbtran | HiTm | T0.30H | BT | Pyr | M40t45 |
| 8.29 | 8.36 | 8.45 | 8.6 | 8.62 | 8.75 | 8.8 | 8.82 | 8.82 | 8.89 |