B. subtilis Expression Data Browser
Start Page
B. subtilis Expression Data Browser
Gene/Segment:
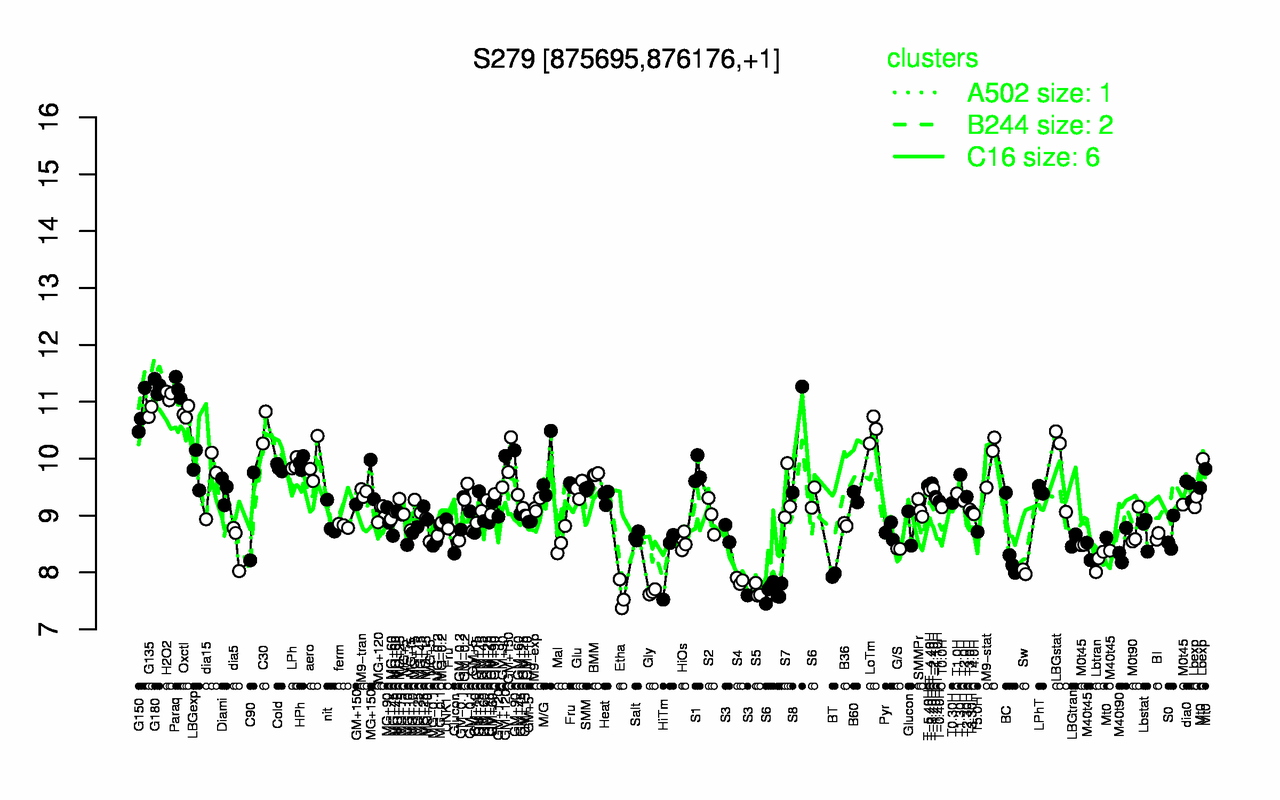
S279
Locus Tag:
new_875695_876176
Details about S279
Show/Hide
Highest Expression Conditions
G180
Paraq
H2O2
G135
Oxctl
G150
C30
LoTm
S8
M9-stat
11.3
11.2
11.1
10.8
10.8
10.8
10.5
10.5
10.3
10
Lowest Expression Conditions
Etha
Gly
S5
S4
BT
Sw
S6
Lbtran
HiTm
S3
7.59
7.66
7.67
7.86
7.95
8.01
8.04
8.21
8.23
8.32
Most Positively Correlated Segments
S280
S311
S242
S1044
S14
S838
S241
S36
S1045
yefC
0.77
0.76
0.71
0.71
0.71
0.7
0.7
0.7
0.7
0.7
Most Negatively Correlated Segments
malS
yjcF
yjcG
yvyD
ssrA
dat
phrI
yraJ
S1101
phrK
-0.67
-0.65
-0.64
-0.6
-0.6
-0.59
-0.59
-0.58
-0.58
-0.58
Expression Profile of Segment S279
Show/Hide
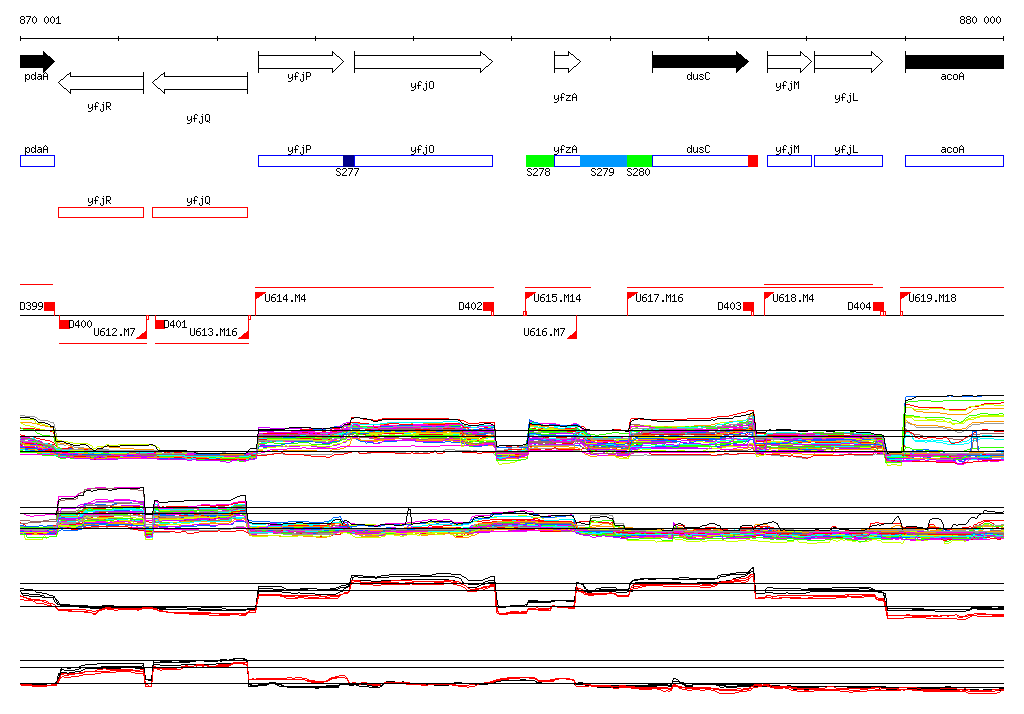
Genomic View of Gene/Segment S279
Show/Hide
(Legend)
Browse Genome Context