| Start Page |
|
 |
| Start Page |
|
|
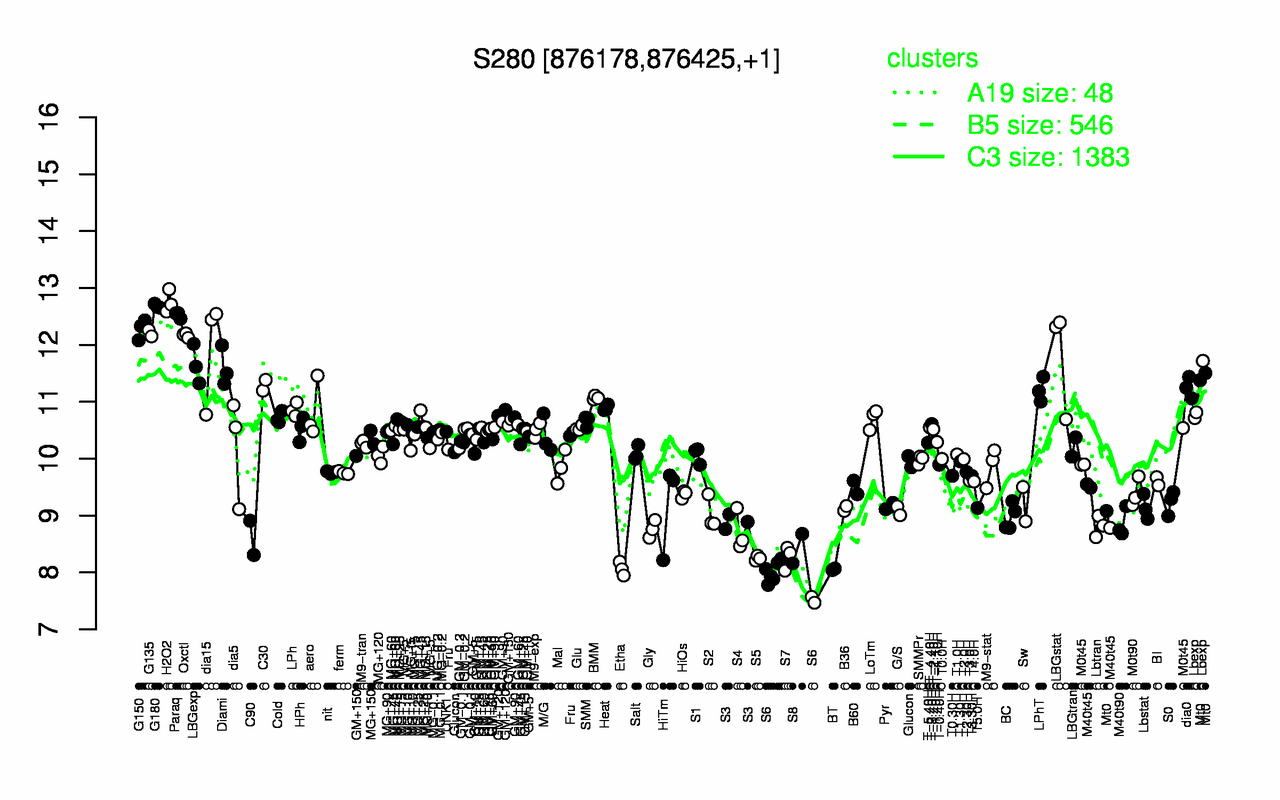
| H2O2 | G180 | Paraq | G150 | G135 | Oxctl | dia15 | LBGstat | LBGexp | Diami |
| 12.8 | 12.7 | 12.5 | 12.3 | 12.2 | 12.2 | 11.9 | 11.8 | 11.7 | 11.6 |
| S6 | BT | Etha | S5 | S7 | S8 | C90 | S4 | Gly | Lbtran |
| 7.92 | 8.06 | 8.06 | 8.25 | 8.27 | 8.42 | 8.61 | 8.72 | 8.76 | 8.81 |