| Start Page |
|
 |
| Start Page |
|
|
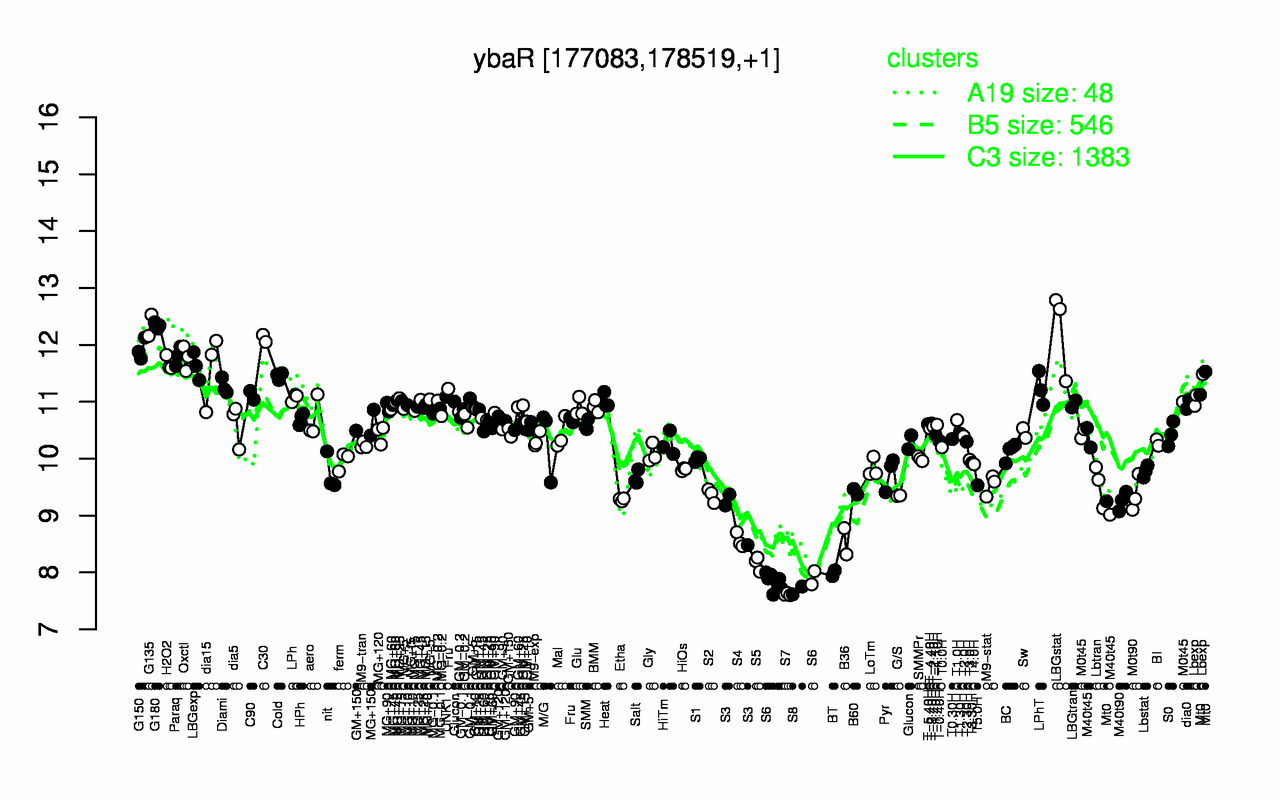
| G135 | G180 | LBGstat | C30 | G150 | Paraq | Oxctl | H2O2 | LBGexp | dia15 |
| 12.3 | 12.3 | 12.3 | 12.1 | 11.9 | 11.8 | 11.8 | 11.7 | 11.6 | 11.6 |
| S7 | S8 | S6 | BT | S5 | B36 | S4 | S3 | M40t90 | Etha |
| 7.62 | 7.68 | 7.86 | 7.99 | 8.16 | 8.55 | 8.56 | 9.01 | 9.25 | 9.28 |