| Start Page |
|
 |
| Start Page |
|
|
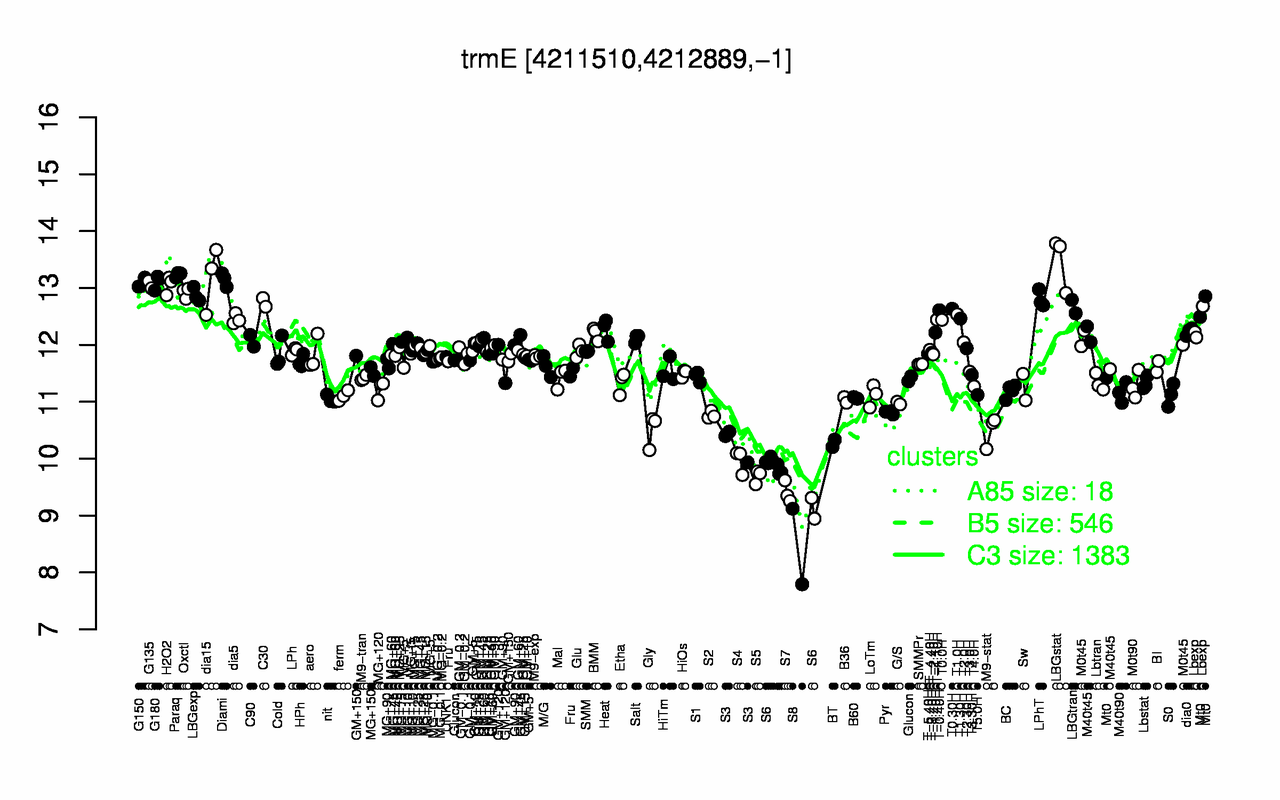
| LBGstat | Paraq | dia15 | Diami | G180 | G150 | G135 | H2O2 | Oxctl | LBGexp |
| 13.5 | 13.2 | 13.2 | 13.1 | 13.1 | 13.1 | 13.1 | 13.1 | 12.9 | 12.9 |
| S8 | S7 | S5 | S6 | S4 | BT | S3 | M9-stat | Gly | S2 |
| 8.46 | 9.41 | 9.69 | 9.72 | 9.97 | 10.3 | 10.3 | 10.5 | 10.5 | 10.8 |