B. subtilis Expression Data Browser
Start Page
B. subtilis Expression Data Browser
Gene/Segment:
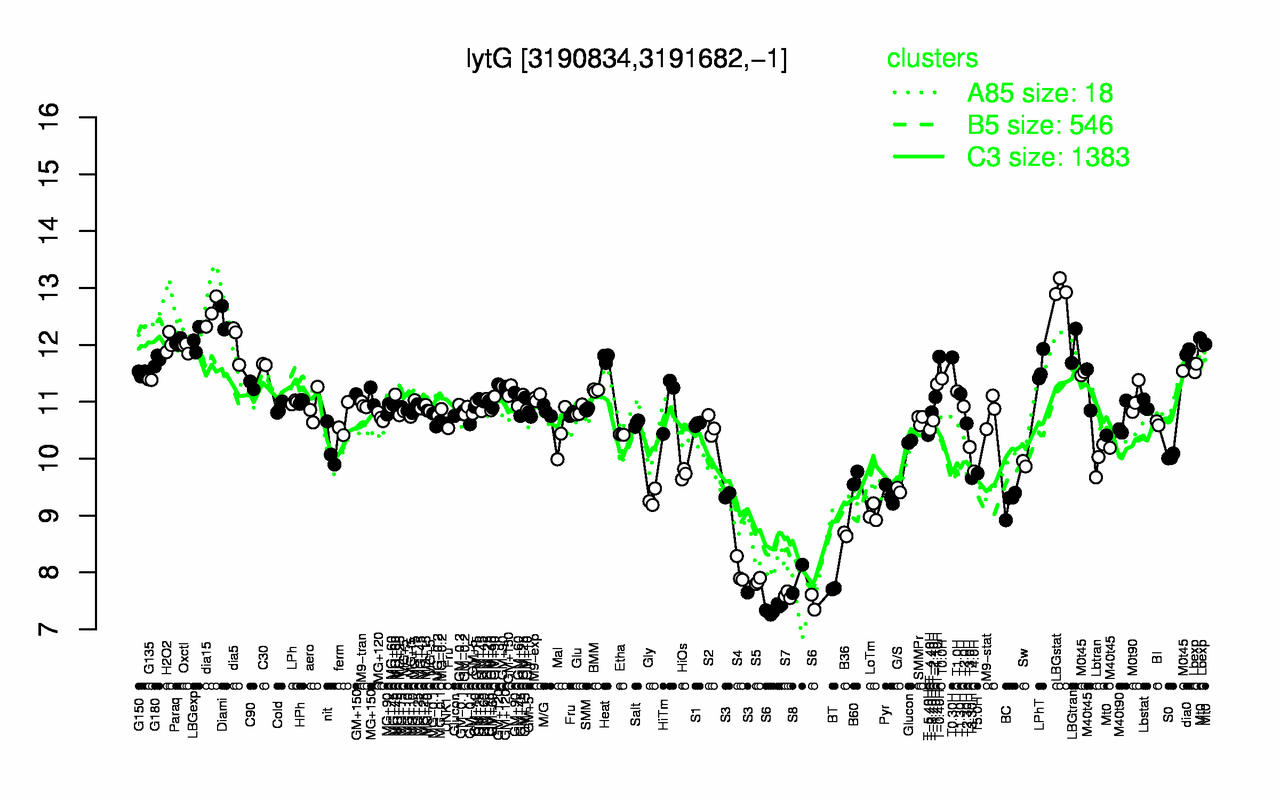
lytG
Locus Tag:
BSU31120
Details about lytG
Show/Hide
Highest Expression Conditions
LBGstat
dia15
Diami
LBGexp
dia5
Paraq
H2O2
LBGtran
Oxctl
dia0
13
12.6
12.4
12.1
12.1
12
12
12
12
11.8
Lowest Expression Conditions
S6
S7
BT
S5
S8
S4
B36
S3
LoTm
BC
7.38
7.6
7.71
7.84
7.88
8.02
8.67
8.79
9.04
9.24
Most Positively Correlated Segments
yvcP
mobA
trmE
S218
yrrL
S1394
yvcQ
yqhL
dnaB
walH
0.91
0.9
0.9
0.89
0.88
0.88
0.87
0.87
0.87
0.86
Most Negatively Correlated Segments
S402
S738
yngJ
yoyB
kamA
yodQ
ybfJ
mpr
yocN
yhfW
-0.86
-0.86
-0.86
-0.86
-0.85
-0.85
-0.85
-0.85
-0.85
-0.85
Expression Profile of Segment lytG
Show/Hide
Annotation of Gene lytG
Show/Hide
function
16.13: Shape
inference
ab initio prediction:AMIGene:2.0
codon_start
1
product
exoglucosaminidase
transl_table
11
note
Evidence 1a: Function experimentally demonstrated in the studied strain; PubMedId: 12525152, 16855244; Product type e: enzyme
db_xref
GI:2635596
protein_id
CAB15090.1
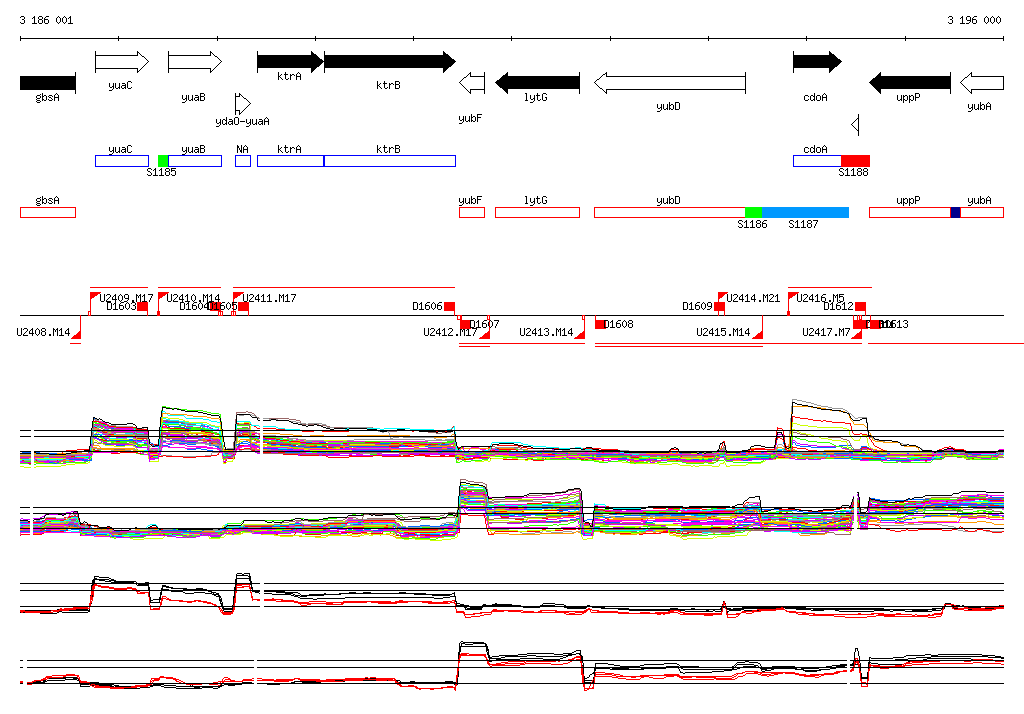
Genomic View of Gene/Segment lytG
Show/Hide
(Legend)
Browse Genome Context