B. subtilis Expression Data Browser
Details about ssrA Show/Hide
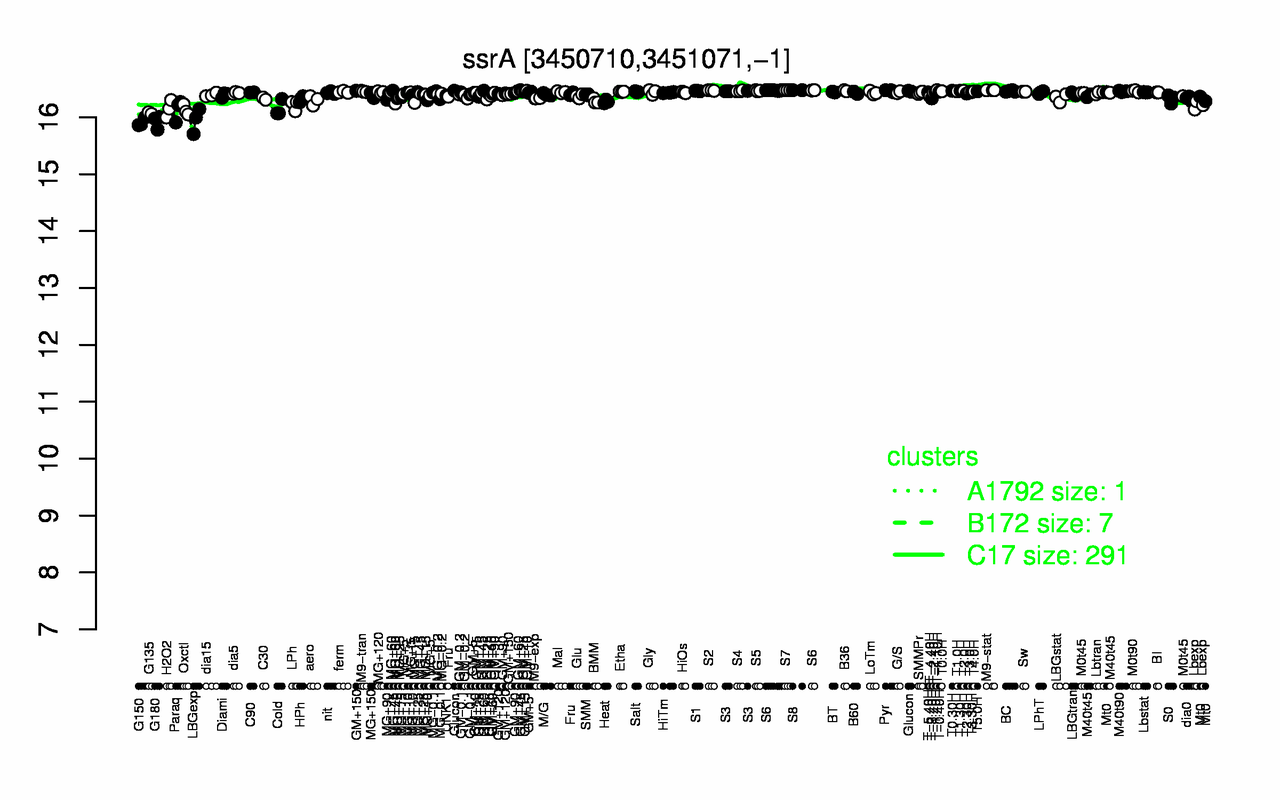
Highest Expression Conditions
M9-stat S7 S8 T-1.10H S6 S2 B36 S5 T0.30H T1.30H
16.5 16.5 16.5 16.5 16.5 16.5 16.5 16.5 16.5 16.5
Lowest Expression Conditions
G150 G180 LBGexp G135 Oxctl Paraq H2O2 Cold Lbexp LPh
15.9 15.9 15.9 16.1 16.1 16.1 16.2 16.2 16.2 16.2
Most Positively Correlated Segments
S1101 citZ spoVG yjcG phrI yhaA dat yvyD S809 yjcF
0.74 0.73 0.73 0.73 0.73 0.73 0.72 0.72 0.71 0.71
Most Negatively Correlated Segments
S1322 ywpE S241 yefC S242 exoAA S311 yyzO ykkC prmC
-0.78 -0.78 -0.77 -0.77 -0.76 -0.75 -0.75 -0.74 -0.74 -0.74
Expression Profile of Segment ssrA Show/Hide
Genomic View of Gene/Segment ssrA Show/Hide
(Legend)