B. subtilis Expression Data Browser
Details about S1215 Show/Hide
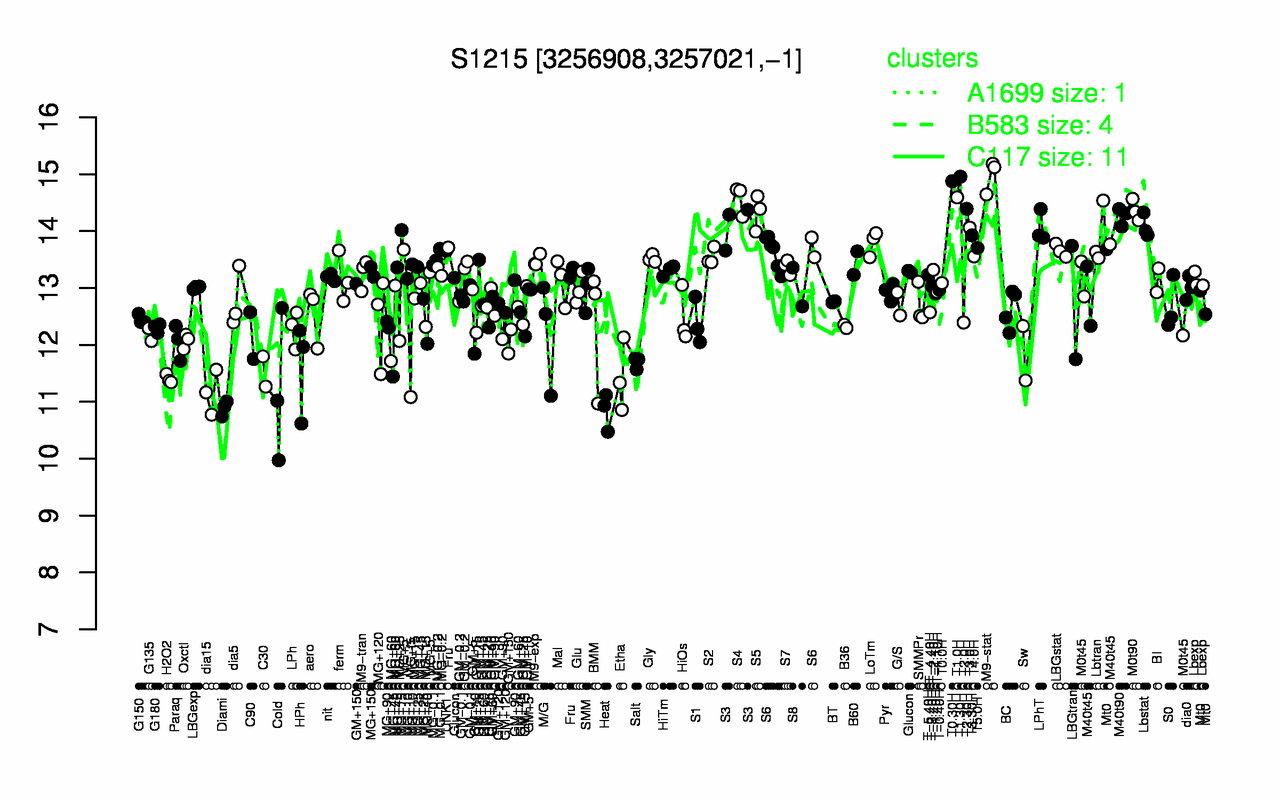
Highest Expression Conditions
M9-stat T1.30H T0.30H T1.0H S4 T2.30H M0t90 S5 M40t90 S3
15 15 14.9 14.6 14.6 14.4 14.4 14.3 14.3 14.1
Lowest Expression Conditions
Heat Diami MG+t5 dia15 Cold H2O2 Etha C30 HPh Salt
10.8 10.9 11.1 11.2 11.2 11.4 11.4 11.5 11.6 11.7
Most Positively Correlated Segments
comQ comX phoP comP S1110 ytzJ S544 cdd phoR S725
0.76 0.74 0.67 0.65 0.64 0.63 0.62 0.62 0.61 0.61
Most Negatively Correlated Segments
S499 mtrB folEA S266 ycnB rimO ynbB clpX smpB hslO
-0.64 -0.6 -0.6 -0.6 -0.59 -0.59 -0.59 -0.58 -0.58 -0.58
Expression Profile of Segment S1215 Show/Hide
Genomic View of Gene/Segment S1215 Show/Hide
(Legend)