B. subtilis Expression Data Browser
Details about phoP Show/Hide
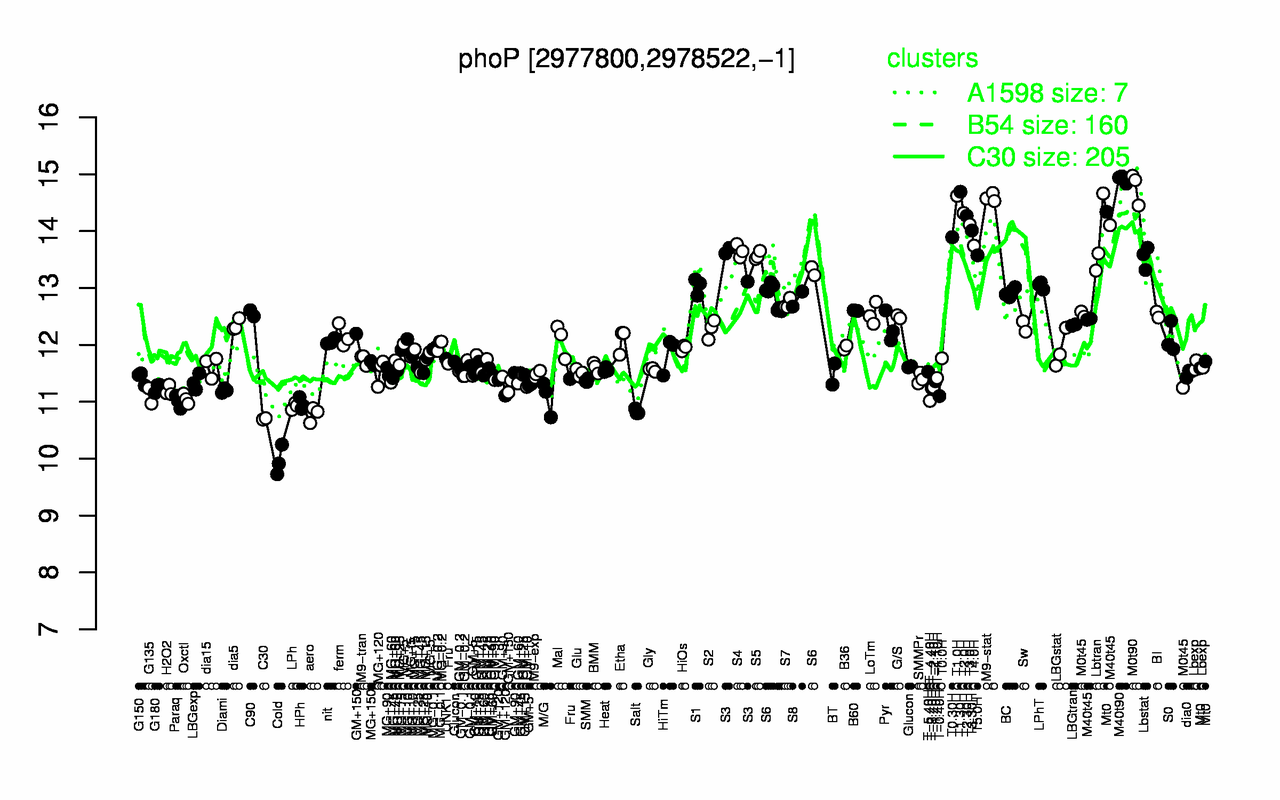
Highest Expression Conditions
M40t90 M0t90 T1.30H T1.0H M9-stat T2.0H T2.30H T3.0H T3.30H T0.30H
14.9 14.8 14.7 14.6 14.6 14.3 14.3 14.1 14 13.9
Lowest Expression Conditions
Cold C30 aero Salt LPh HPh Paraq T-4.40H Oxctl M/G
9.96 10.7 10.8 10.8 10.9 11 11 11 11.1 11.1
Most Positively Correlated Segments
phoR S1097 amyC yugM amyD yobO yhaR yesL msmE S1098
0.98 0.9 0.83 0.82 0.82 0.82 0.82 0.81 0.81 0.81
Most Negatively Correlated Segments
rplL yugI ybxB rimO rplJ xseB rsmE rpmH ycnB rpsE
-0.79 -0.79 -0.79 -0.79 -0.78 -0.77 -0.77 -0.77 -0.77 -0.77
Expression Profile of Segment phoP Show/Hide
Annotation of Gene phoP Show/Hide
function
16.3: Control
inference
ab initio prediction:AMIGene:2.0
codon_start
1
product
two-component response regulator
transl_table
11
note
Evidence 2a: Function of homologous gene experimentally demonstrated in an other organism; PubMedId: 14762014, 14973033, 15205429, 16030210, 16452408, 16816204; Product type r: regulator
db_xref
GI:225185300
protein_id
CAB14871.2
Genomic View of Gene/Segment phoP Show/Hide
(Legend)