| Start Page |
|
 |
| Start Page |
|
|
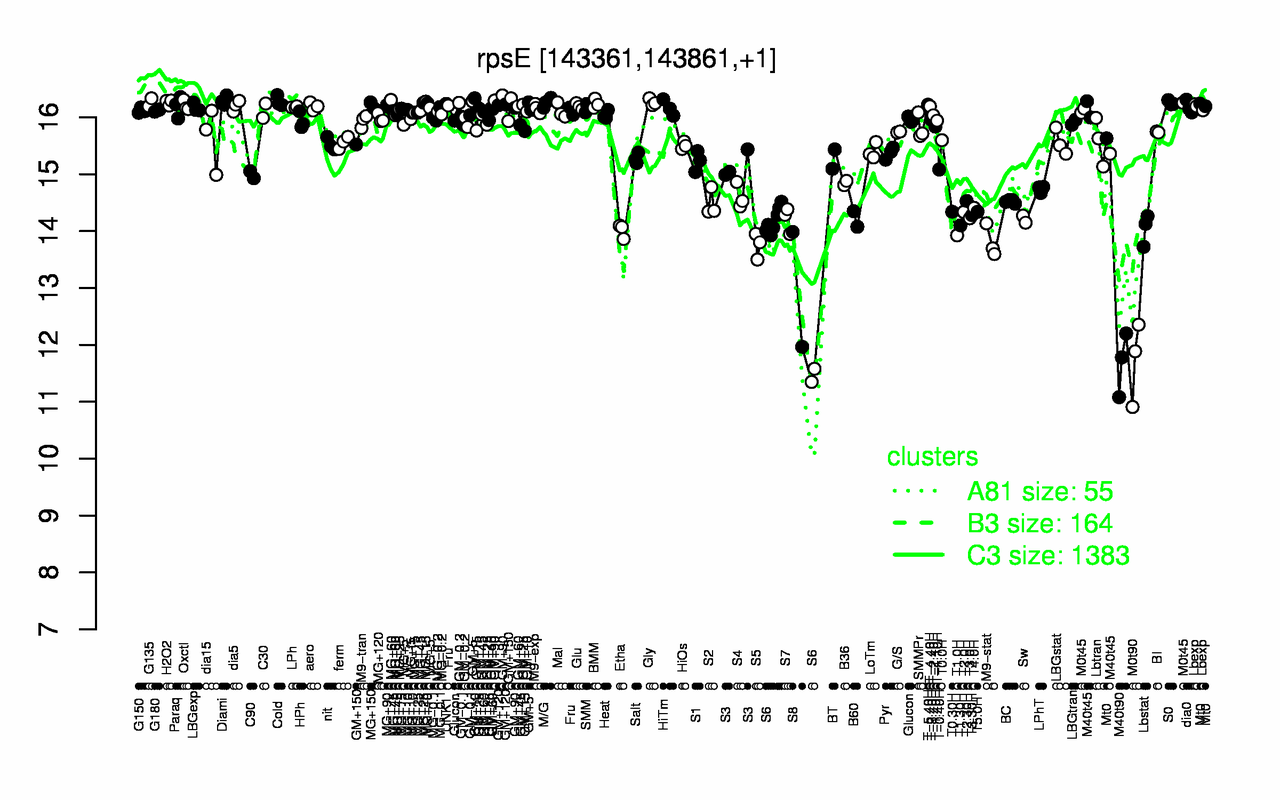
| Diami | Cold | GM+90 | Gly | G135 | H2O2 | M/G | S0 | BMM | UNK1 |
| 16.3 | 16.3 | 16.3 | 16.3 | 16.3 | 16.3 | 16.3 | 16.3 | 16.2 | 16.2 |
| M40t90 | M0t90 | S8 | S6 | S5 | M9-stat | T1.0H | Etha | Lbstat | T1.30H |
| 11.7 | 11.7 | 13 | 13.6 | 13.8 | 13.8 | 13.9 | 14 | 14 | 14.1 |