| Start Page |
|
 |
| Start Page |
|
|
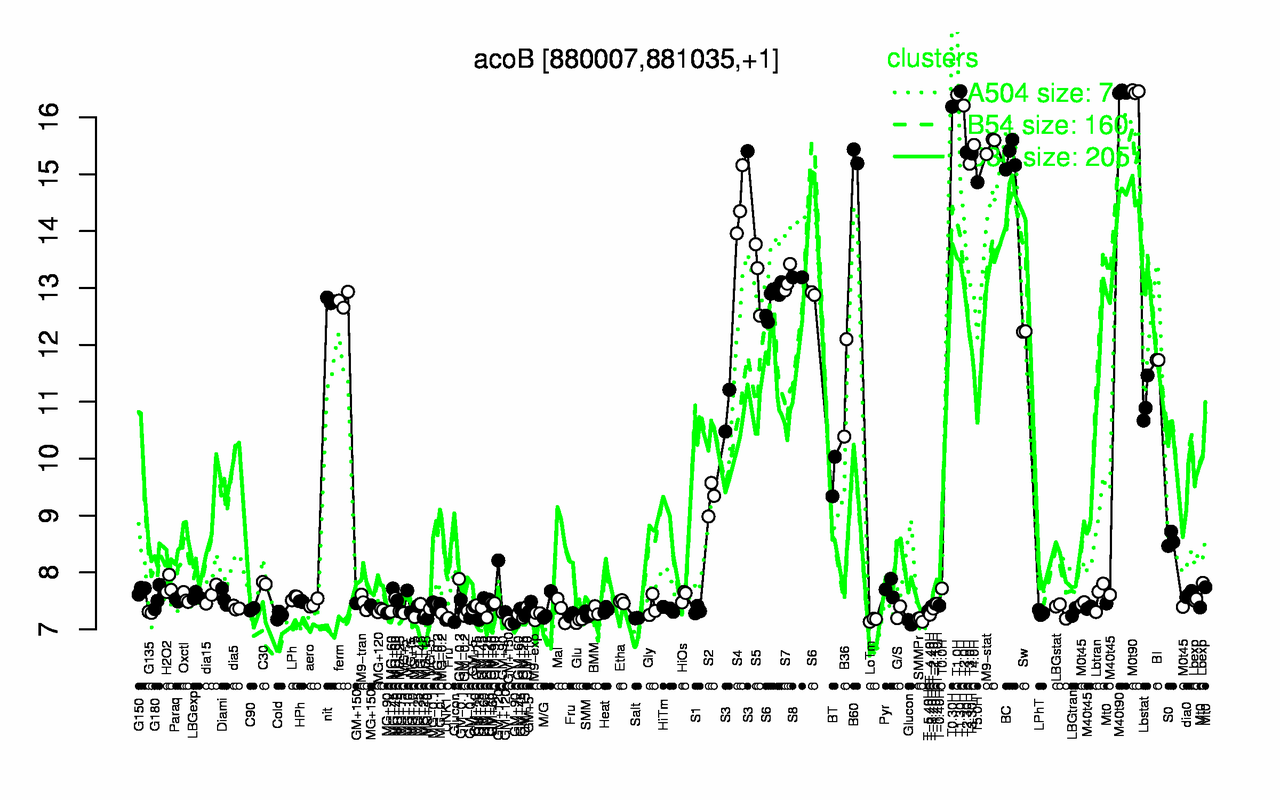
| T1.30H | M0t90 | M40t90 | T1.0H | T2.0H | T0.30H | M9-stat | T4.0H | T2.30H | T3.30H |
| 16.5 | 16.5 | 16.4 | 16.4 | 16.2 | 16.2 | 15.5 | 15.5 | 15.4 | 15.4 |
| Glucon | Glu | LoTm | UNK1 | SMMPr | GM+25 | Salt | GM+150 | Fru | M9-exp |
| 7.13 | 7.15 | 7.17 | 7.17 | 7.17 | 7.19 | 7.2 | 7.23 | 7.24 | 7.24 |