| Start Page |
|
 |
| Start Page |
|
|
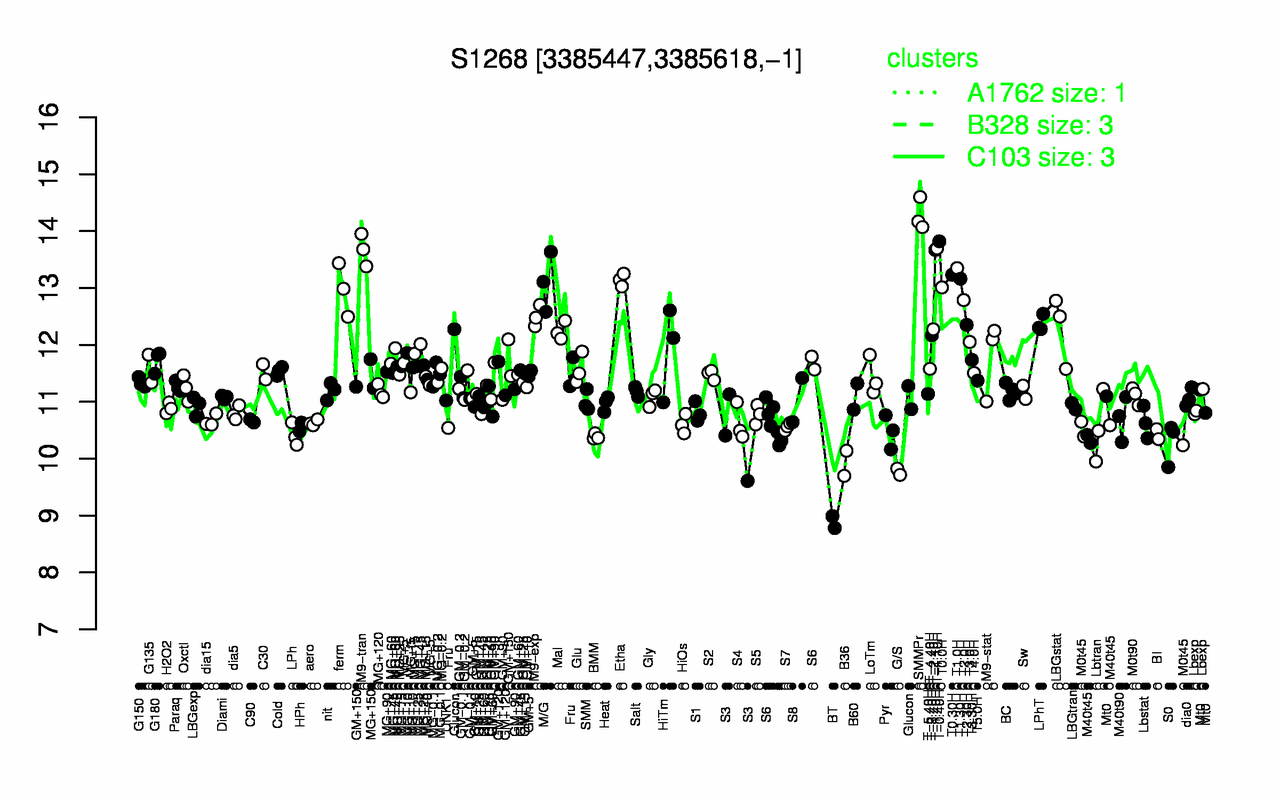
| SMMPr | T-0.40H | T-1.10H | M9-tran | T-1.40H | T1.0H | T0.30H | T1.30H | Etha | M/G |
| 14.3 | 13.8 | 13.7 | 13.7 | 13.7 | 13.3 | 13.2 | 13.2 | 13.1 | 13.1 |
| BT | G/S | B36 | S0 | S3 | BMM | LPh | M0t45 | M40t45 | BI |
| 8.89 | 9.77 | 9.92 | 10.3 | 10.4 | 10.4 | 10.4 | 10.4 | 10.4 | 10.4 |