| Start Page |
|
 |
| Start Page |
|
|
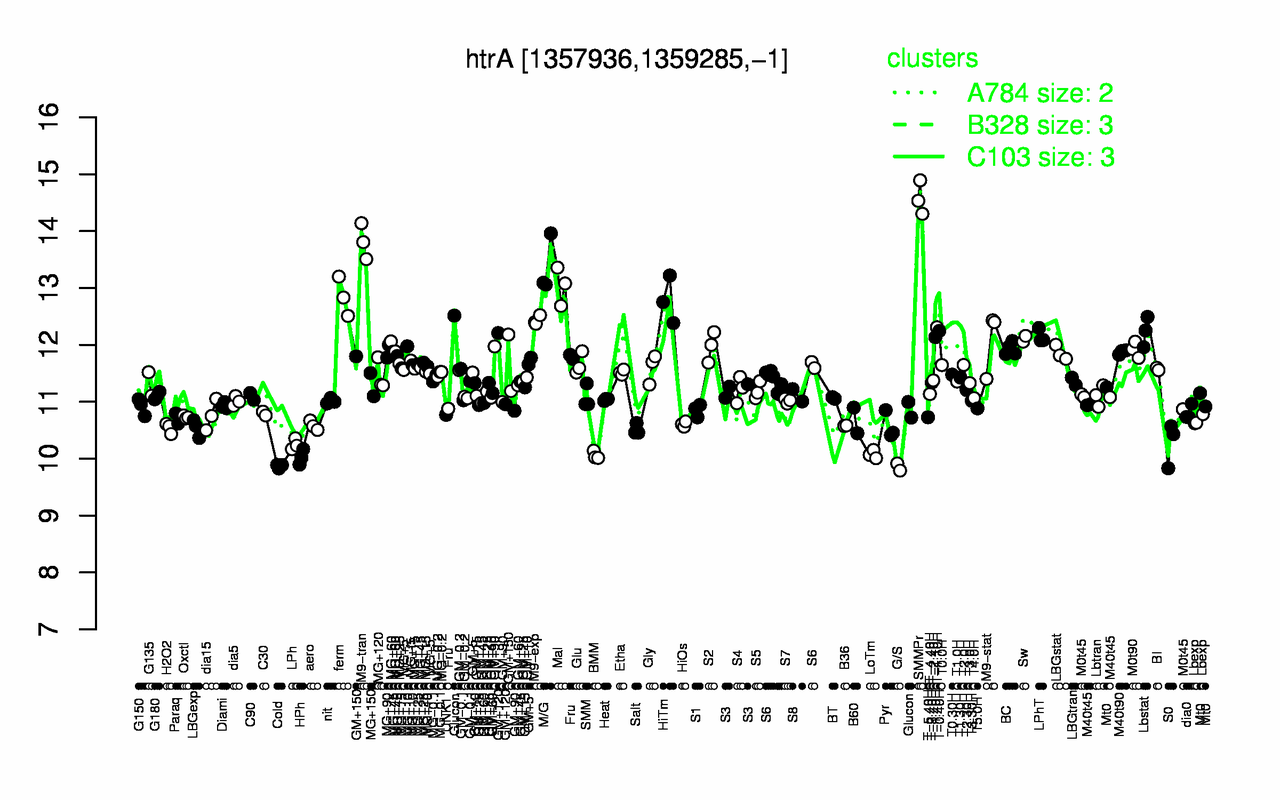
| SMMPr | M9-tran | M/G | Mal | ferm | HiTm | M9-exp | T-1.10H | T-0.40H | Lbstat |
| 14.6 | 13.8 | 13.4 | 13 | 12.8 | 12.8 | 12.4 | 12.3 | 12.2 | 12.2 |
| G/S | Cold | HPh | BMM | LoTm | LPh | S0 | Salt | H2O2 | LBGexp |
| 9.85 | 9.87 | 10 | 10.1 | 10.1 | 10.3 | 10.3 | 10.5 | 10.5 | 10.5 |