B. subtilis Expression Data Browser
Start Page
B. subtilis Expression Data Browser
Gene/Segment:
S515
Locus Tag:
new_1484357_1484465
Details about S515
Show/Hide
Highest Expression Conditions
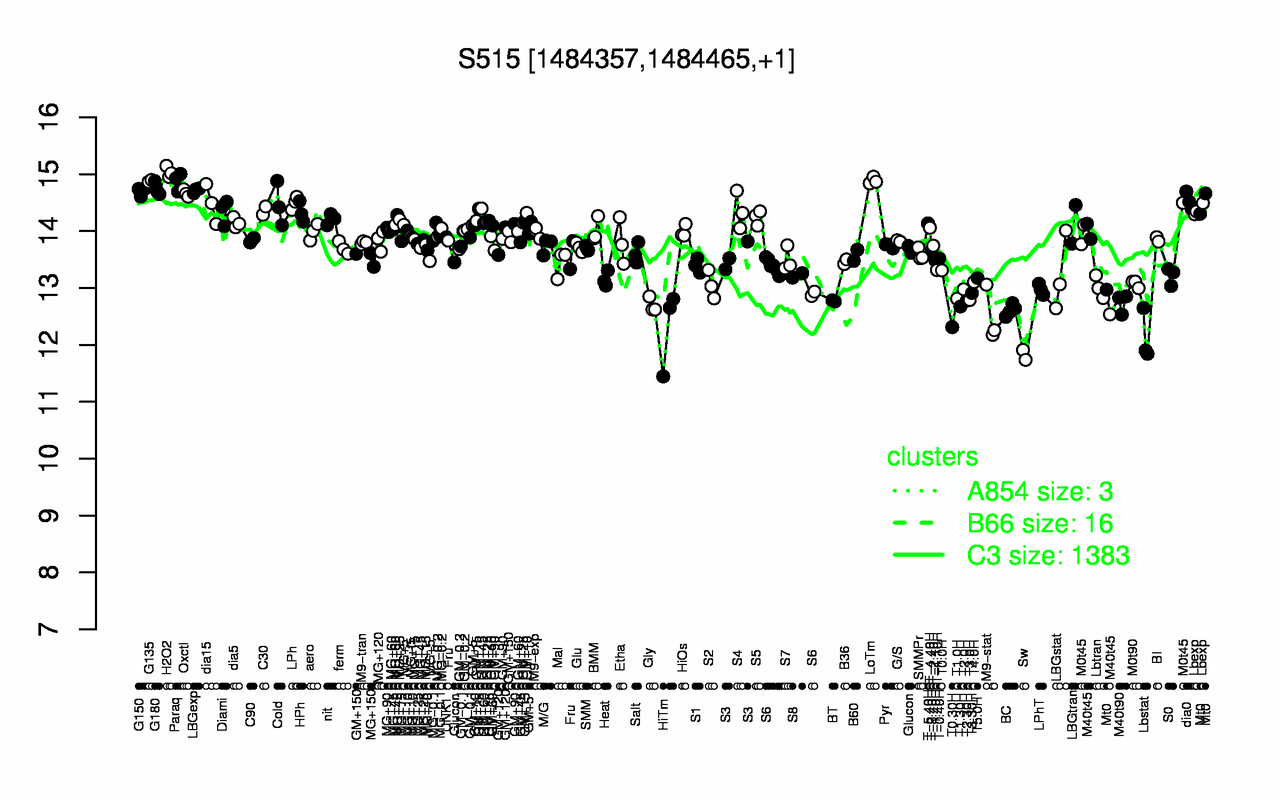
H2O2
LoTm
G135
Paraq
G180
LBGexp
G150
Oxctl
dia0
LPh
15
14.9
14.9
14.9
14.7
14.7
14.7
14.7
14.5
14.5
Lowest Expression Conditions
Sw
Lbstat
HiTm
T0.30H
M9-stat
BC
T1.30H
Gly
M40t90
BT
11.8
12.1
12.3
12.3
12.5
12.6
12.7
12.7
12.7
12.8
Most Positively Correlated Segments
ykuJ
ykuK
dxr
cmk
rnmV
speE
ynbA
ksgA
S867
rluD
0.98
0.95
0.79
0.77
0.76
0.75
0.74
0.74
0.72
0.72
Most Negatively Correlated Segments
yisT
yhcS
yhcR
ylbP
dacC
yraJ
ytaP
S725
yraI
yncM
-0.75
-0.75
-0.75
-0.74
-0.73
-0.72
-0.72
-0.71
-0.71
-0.71
Expression Profile of Segment S515
Show/Hide
Genomic View of Gene/Segment S515
Show/Hide
(Legend)
Browse Genome Context