| Start Page |
|
 |
| Start Page |
|
|
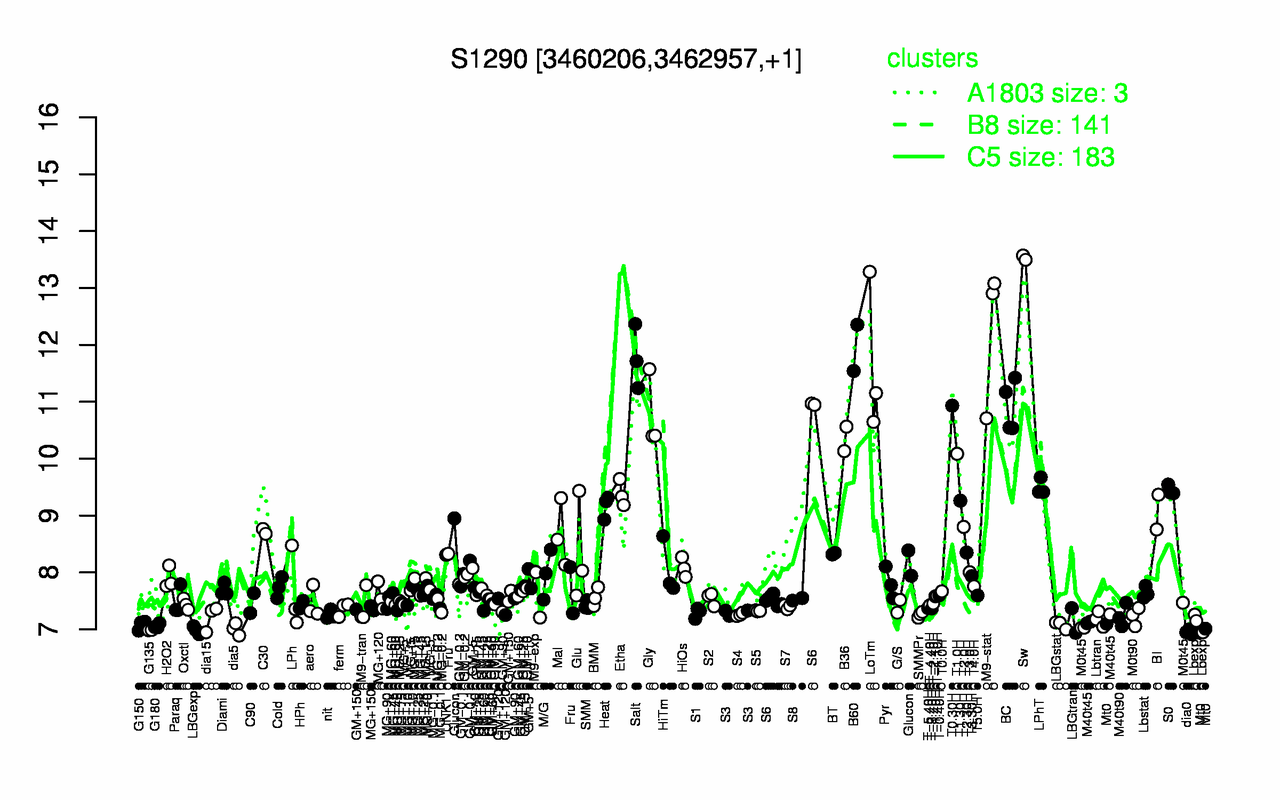
| Sw | M9-stat | B60 | Salt | LoTm | T0.30H | BC | Gly | B36 | T1.0H |
| 13.5 | 12.2 | 11.9 | 11.8 | 11.7 | 10.9 | 10.9 | 10.8 | 10.3 | 10.1 |
| dia0 | LBGexp | G135 | dia5 | Mt0 | G180 | G150 | LBGstat | Lbexp | LBGtran |
| 6.95 | 6.99 | 6.99 | 7 | 7.02 | 7.06 | 7.08 | 7.08 | 7.12 | 7.16 |