B. subtilis Expression Data Browser
Start Page
B. subtilis Expression Data Browser
Gene/Segment:
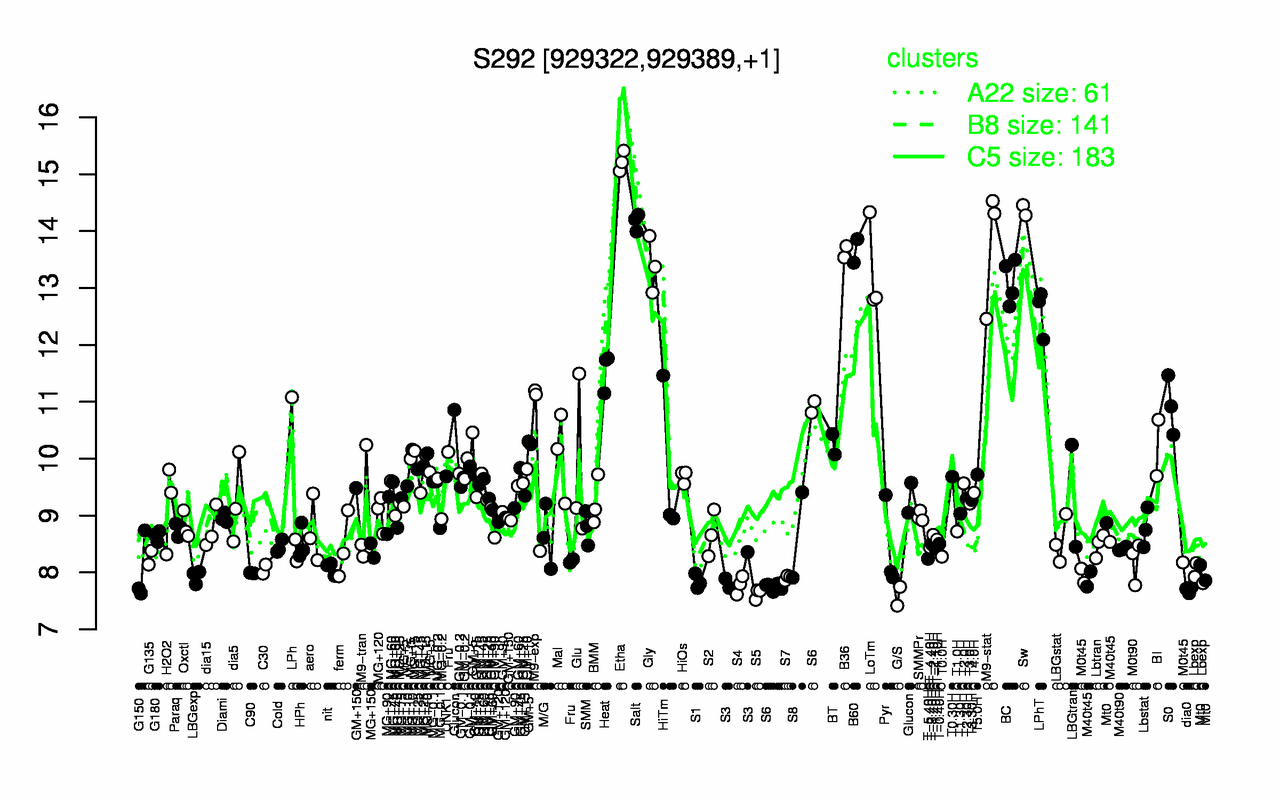
S292
Locus Tag:
new_929322_929389
Details about S292
Show/Hide
Highest Expression Conditions
Etha
Sw
Salt
M9-stat
B60
B36
Gly
LoTm
BC
LPhT
15.2
14.4
14.2
13.8
13.7
13.6
13.4
13.3
13.1
12.6
Lowest Expression Conditions
G/S
S5
dia0
S4
S1
S7
LBGexp
Lbexp
C90
S3
7.58
7.63
7.7
7.78
7.84
7.91
7.93
7.97
7.99
7.99
Most Positively Correlated Segments
yfhK
yoxC
yflA
yqhB
nhaX
katE
csbD
csbC
yoxB
yczO
0.99
0.95
0.94
0.94
0.93
0.93
0.93
0.92
0.92
0.9
Most Negatively Correlated Segments
S867
cmk
yqgU
nucA
yckB
yxjA
S868
yvaV
yloV
yckA
-0.54
-0.53
-0.52
-0.51
-0.5
-0.5
-0.49
-0.47
-0.47
-0.47
Expression Profile of Segment S292
Show/Hide
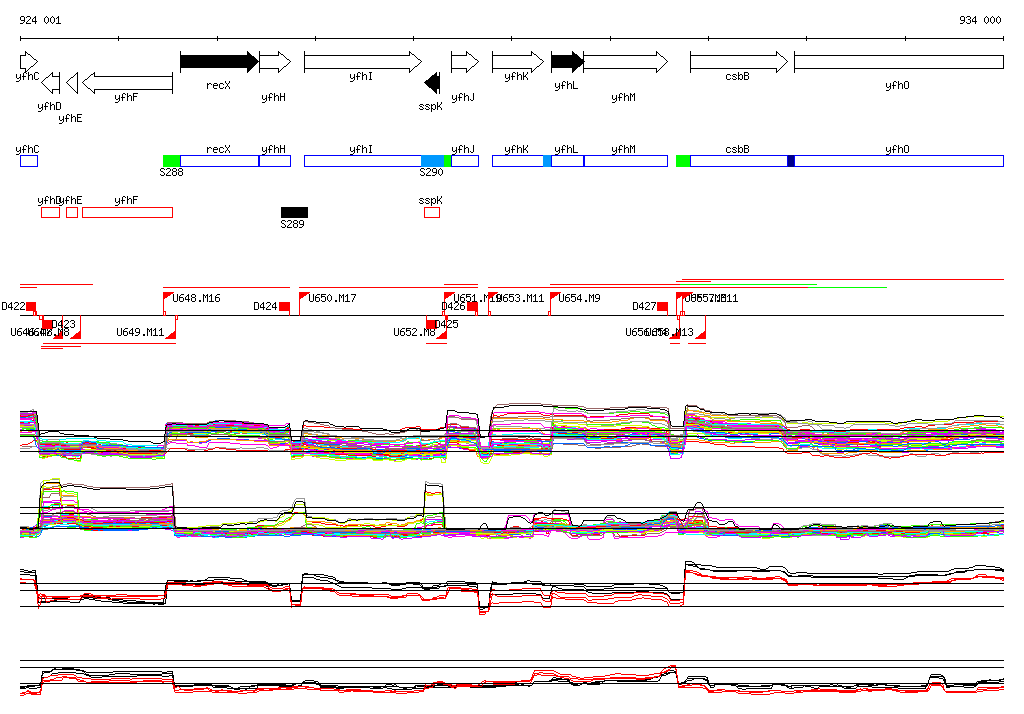
Genomic View of Gene/Segment S292
Show/Hide
(Legend)
Browse Genome Context